What now for all that data collected from the #birdatlas? What lies #beyondthemaps?
In February, Dawn Balmer described the rollercoaster-ride of bringing Bird Atlas 2007-11 to fruition. Back to the day job then and no more talk of atlases for 20 years, right? Well, no, because the Atlas book is really just the first and most visible output that we hope to produce from the 19 million records collected by Bird Atlas volunteers in Britain and Ireland.
The second major output is an exciting new online facility making it possible for the first time to view all the maps from the three breeding atlases and two winter atlases of Britain and Ireland produced by BTO, BirdWatch Ireland and the Scottish Ornithologists’ Club. The Mapstore (hosted by the BTO) is designed partly as an online appendix to Bird Atlas 2007-11, to present all the maps for species we couldn’t fit in the book (if you really want to know where that Violet Turaco spent the winter!). But it also shows the different permutations of distribution change across the atlas periods, and highlights one of the biggest research challenges we now face.
In its 1,300 maps, the Atlas illustrates countless patterns and changes yet our ability to explain these is far from complete. Whilst we might look at the current breeding distribution of the Red Kite and easily spot the similarity with the locations of release sites, it is unclear what causes many species to live where they do. Why, for instance, do Goldfinches breed further up British mountains than Greenfinches? The answer may be of a purely academic interest to some, but the fact that these two species are changing the elevations at which they occur, could tell us much about how our bird populations are responding to environmental change, including climate change.
So now that the book is out we’re directing the underlying data to pressing conservation problems and research questions. Here are some of the projects the BTO is now working on, including those involving our conservation and research partners.
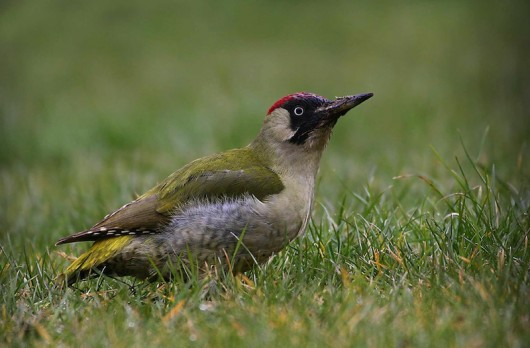
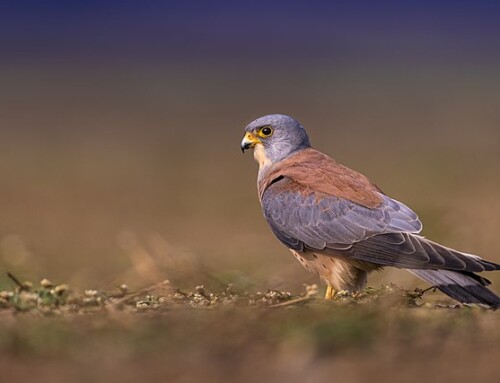
Is the west to east shift in distribution and abundance of the Green Woodpecker a climate response or linked to some aspect of land-use change? © Jill Pakenham
Range shifts and climate change
Analyses of previous atlas data have provided some of the most widely cited instances of poleward shifts in distributions, often used as evidence of the impact of climate change on biodiversity. New data from Bird Atlas 2007-11 offer the opportunity to update these estimates of range shift, to give an overview of change over 40 years. They also allow us to consider whether the range dynamics of species are more complex than simply shifting north or south (think of the east-west patterns for Green Woodpecker for instance). And they allow us to look more closely at the potentially confounding effects of changes in recording effort, or the influence of other environmental changes. From a casual read of the Atlas and other bird trend information it is clear that some species we associate with warmer climates and would expect to be marching northwards, such as Nightingale and Turtle Dove, are doing the exact opposite for other reasons. Whilst there is intensive work already underway on these species (e.g. Operation Turtle Dove), the Atlas data can tell us if there are other species that are not responding to climate change, or are doing so at a slower than expected rate, which might point to other problems. It will also be interesting to test whether recent range shifts among birds are similar to those for other taxa, and whether there is a similar complexity of directional responses.
Upland birds
If farmland birds were the big headline in the 1988-91 Breeding Atlas then upland birds are probably one of the main headlines from Bird Atlas 2007-11, with significant range losses and abundance declines for many of our characteristic upland species, and for waders in particular. The recent BOU conference highlighted the large body of work already underway in the uplands, so finding where atlas data can best contribute to knowledge will be important. In my presentation at the conference I revealed provisional results showing that the suite of species we might consider as ‘upland- birds has changed. Some of these changes are welcome: Buzzard and Red Kite are no longer confined to the uplands thanks to range expansion in the lowlands. But some of the additions to the list are perhaps more concerning. Spotted Flycatcher, Willow Warbler and Cuckoo could, arguably, be called upland species now owing to significant abundance declines throughout the lowlands. Concurrently, several species now appear to occur at higher elevations than they did 20 years ago. There is a clear need to unravel these changes and identify where the balance of causation lies, whether it is in the lowlands, the uplands, or potentially outside Britain.
Urban birds
We have to thank the volunteers of some of the local atlases undertaken during the 2007-11 period for the staggering levels of coverage using ‘Timed Tetrad Visits- – providing standardised abundance and occupancy information at a 2-km resolution for large swathes of north Wales, southeast England and northern England through to southeast Scotland. These data provide an unrivalled opportunity to look at bird occurrence across rural-urban gradients in these areas. It’s not rocket science that some species don’t occur in our city centres, but what could be especially revealing is to consider whether the relationship between a species’ abundance and the degree of urbanisation, or particular features of the urban environment, are constant. Or do some species persist further towards the centres of some cities than others, which might hint at particular management that has benefitted birds and could be exported to other cities? And what’s better for birds might just be better for us too.
 Right: the scope for fine-scale analyses is illustrated by this map showing fixed-effort distribution information for Swallow at 2-km resolution across part of southeast England
These are just three of the broad areas where we hope to put atlas data to work to answer contemporary conservation questions. Alongside these we have ongoing collaborations with academics with complementary skills and data on projects concerning ecosystem services and conservation planning. We are also keen to use atlas data alongside other BTO datasets to refine field and analytical techniques for application in Britain and further afield. BTO is currently running an appeal to fund this broad spectrum of research – to enable us to go #beyondthemaps.
Blog with #theBOUblog
If you want to write about your research in #theBOUblog, then please see here.