 LINKED PAPER
Conservation beyond boundaries: using animal movement networks in protected area assessment. Nightingale, J., Gill, J.A., Þórisson, B., Potts, P.M., Gunnarsson, T.G., Alves, J.A. 2023 Animal Conservation. doi: 10.1111/acv.12868 VIEW
Amongst conservationists’ tools to halt and reverse biodiversity loss, one of the most important is the designation of statutory protected areas. However, the birds (and other animals) for which they are designated are often highly mobile. Coastal waterbirds, for example, move with the tides between feeding and roosting areas, and their seasonal migrations may span continents.
These movements frequently cross the boundaries of protected areas, with implications for environmental impact assessments (EIA). For example, birds’ movements may take them between impacted and unimpacted areas. Therefore, impacted birds will be spread over an area far wider than the extent of the environmental impact itself, and turnover of individuals within the impacted area may cause count data to underestimate the total number affected.
In our recent paper in Animal Conservation, we used bird movement data to determine how movements of Black-tailed Godwits (Limosa limosa) in the Tagus Estuary affect the population’s vulnerability to a proposed development.
Network analysis
To investigate how bird movements influence the size of an impact’s footprint, we developed an approach using network analysis of connectivity between sites. A “network” is simply a collection of objects (dubbed nodes; in our case, sites used by birds) that are connected (by edges; here, a within-year movement by one or more birds).
Network analysis allows us to calculate the importance of individual nodes (sites) to overall connectivity, as well as to measure properties of the network as a whole and thus compare networks.
Some simple, but useful, network measures include:
- degree: the number of other nodes to which the focal node is connected (to identify sites functioning as ‘hubs’);
- betweenness: the number of shortest-paths through the network that pass through the focal node (to identify sites functioning as ‘stepping stones’ or ‘bottlenecks’);
- centralisation: how much the network depends on the site with highest betweennesss (how redundant is the network?)
- edge density: the proportion of possible edges between nodes that are actually observed (how connected is the network?)
Network analysis methods have a long history of being applied to animal movements, but despite their potential have never become a mainstream component of applied analyses – perhaps due to difficulty in aligning network metrics with conservation goals or the provisions of legislation.
When a major threat to conservation arose in my PhD study site, I decided to use the information our research group has collected on Black-tailed Godwit movements to evaluate how their journeys around the estuary might affect the population’s susceptibility to disturbance from an airport development.
Case study
The Tagus Estuary, on whose banks Lisbon rests, is Portugal’s largest wetland and one of Iberia’s most important areas for waterbirds. Part of the estuary is designated as a Special Protection Area (SPA) under the EU’s Birds Directive, intended to protect bird populations therein from threats such as habitat loss and disturbance.
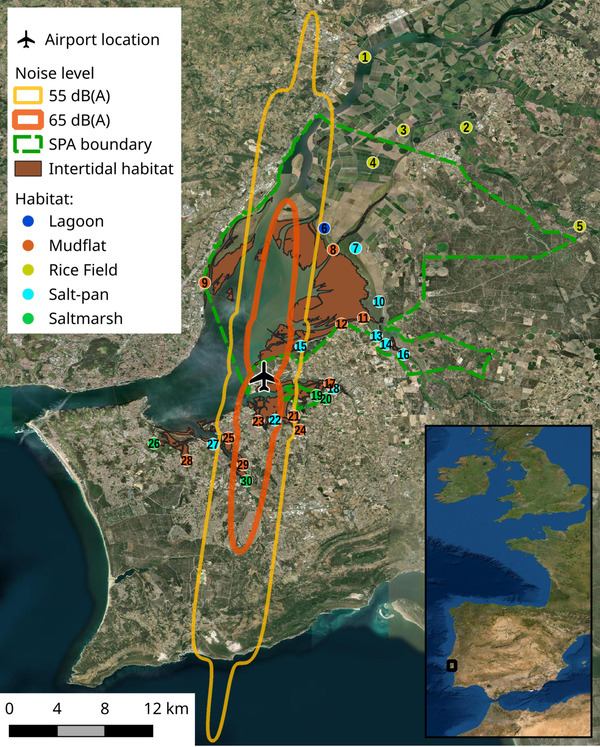
Figure 1 Location of the planned airport in Montijo (aircraft symbol), with the spatial extent of two levels of noise predicted to occur over the Tagus estuary, including on the Tagus Estuary Special Protection Area (SPA; green polygon) and adjacent estuarine habitats (orange contours). The locations and habitats of 30 sites used by individually tracked godwits are shown with coloured circles.
Despite this (and other) designations, the Portuguese Environment Agency approved in 2020 plans submitted by a private company to build an international airport in the heart of the estuary (Figure 1). The intended flight paths for take off and landing pass over much of the protected area’s intertidal feeding habitat for waterbirds.
Citing a study of waterbird responses to three-second blasts of an airhorn (Wright et al. 2010), the airport developer’s EIA determined that 65 dB (where 25% of birds take flight) was an adequate threshold for determining the area of habitat requiring compensation; the precautionary principle suggests that 55 dB, where birds show altered behaviour, would be more appropriate. We therefore compared the impact of disturbance above each threshold with the present-day (pre-development ) network.
Making use of networks
Icelandic Black-tailed Godwits (Limosa limosa islandica), thousands of which spend the winter in the Tagus, have been colour-ringed at various sites across their distribution since 1993, and a network of volunteer observers has helped to accumulate 100,000+ georeferenced observations of 5,000 individual Black-tailed Godwits throughout their lives.
This incredible effort allowed us to extract records of 673 birds that winter in the Tagus, and provided evidence of their local movements (where birds were recorded at multiple sites in the Tagus during a winter) to build a network of sites in the Tagus, as connected by Black-tailed Godwits (Figure 2).
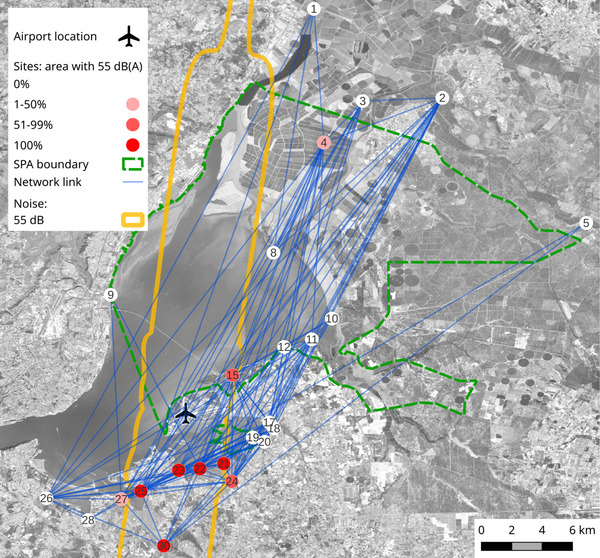
Figure 2 Connectivity among sites across the Tagus estuary. Sites are represented by dots coloured according to the % of site area overlapping with the projected 55 dB noise isophone (yellow contour). Blue lines indicate connections between sites in the godwit network, each representing a movement by 1+ individually marked godwit(s) within a winter season. The boundary of the Tagus estuary Special Protection Area is shown in green.
Black-tailed Godwits connect all parts of the estuary, from the SPA in the north-east to the more urbanised south-west. Indeed, we found that the majority (61%) of marked birds that use sites within the SPA also use unprotected sites: conserving this population therefore depends on what happens outside the protected area.
Due to their movements, 44.6% of the SPA’s Black-tailed Godwit population would be exposed to disturbance from aircraft, even though many of the most severely impacted areas are outside the SPA itself. This is far greater than the estimates in the EIA, of 0.5-5.5%, which were based on limited count data.
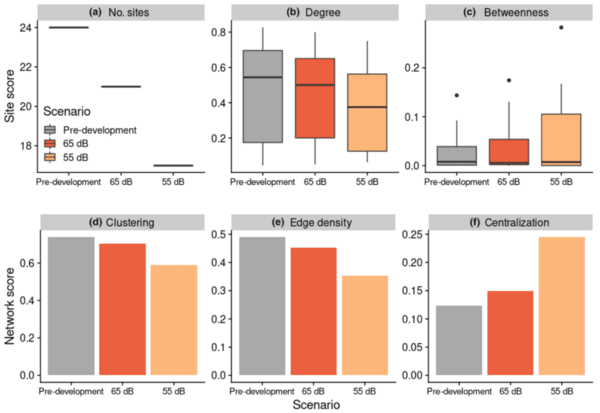
Figure 3 Differences between the characteristics of the current (pre-development) network of godwit movement across the Tagus estuary, and the networks predicted to result from noise impact scenarios at 55 or 65 dB at the site-level (top row); (a) number of sites remaining in the network after removing sites above the disturbance threshold; (b) degree (proportion of connections to other sites in the network); and (c) betweenness (higher values = greater tendency to function as bottlenecks); and at whole-network level (bottom row); (d) clustering (higher values = sites more clustered into subgroups); (e) edge density (proportion of all possible connections between sites that are observed in the network); and (f) centralization (strength of a network-wide ‘bottleneck’ effect). Boxplot boxes show first quartile, median and third quartile; whiskers indicate range of data with outliers (>1.5*IQR) represented by points.
We then simulated scenarios in which birds avoided sites chronically disturbed by noise over 65 or 55 dB, by removing those sites from the network and recalculating network metrics using the remaining movements. Removing those options from Black-tailed Godwits leads to a network with higher centralisation (vulnerability to impacts on the remaining important sites) and lower edge density (overall connectivity between sites; Figure 3).
Conclusions
Network analysis can be a useful technique to assess the importance of particular sites for connectivity, and/or the impacts of site loss on the wider movement behaviour of birds.
This holistic approach to studying movement behaviour and connectivity is flexible and widely applicable, and may be especially useful in situations where movement of individuals could make the impact of a development broader than suggested by counts alone.
Our study also highlights the value of long-term monitoring of bird populations, and the unexpected uses to which such data can be put. As long-running studies accumulate data, and the miniaturisation of satellite tags (and public archiving of their data) continues apace, we believe that network analysis offers promising avenues to distil insight into complex behaviours from such datasets.
Read more about this work over on the Wader Tales blog here.
References
Alves, J.A. 2020. Perhaps the most prominent threat to waders in the East Atlantic Flyway. Wader Study 127:89-91. VIEW
Jacoby, D.M.P. & Freeman, R. 2016. Emerging Network-Based Tools in Movement Ecology. Trends in Ecology and Evolution 31:301-314. VIEW
Nightingale, J. 2020. Getting started with network analysis of animal movements in R. Medium. VIEW
Wright, M.D., Goodman, P. & Cameron, T.C. 2010. Exploring behavioural responses of shorebirds to impulsive noise. Wildfowl 60:150-167. VIEW
Image credit
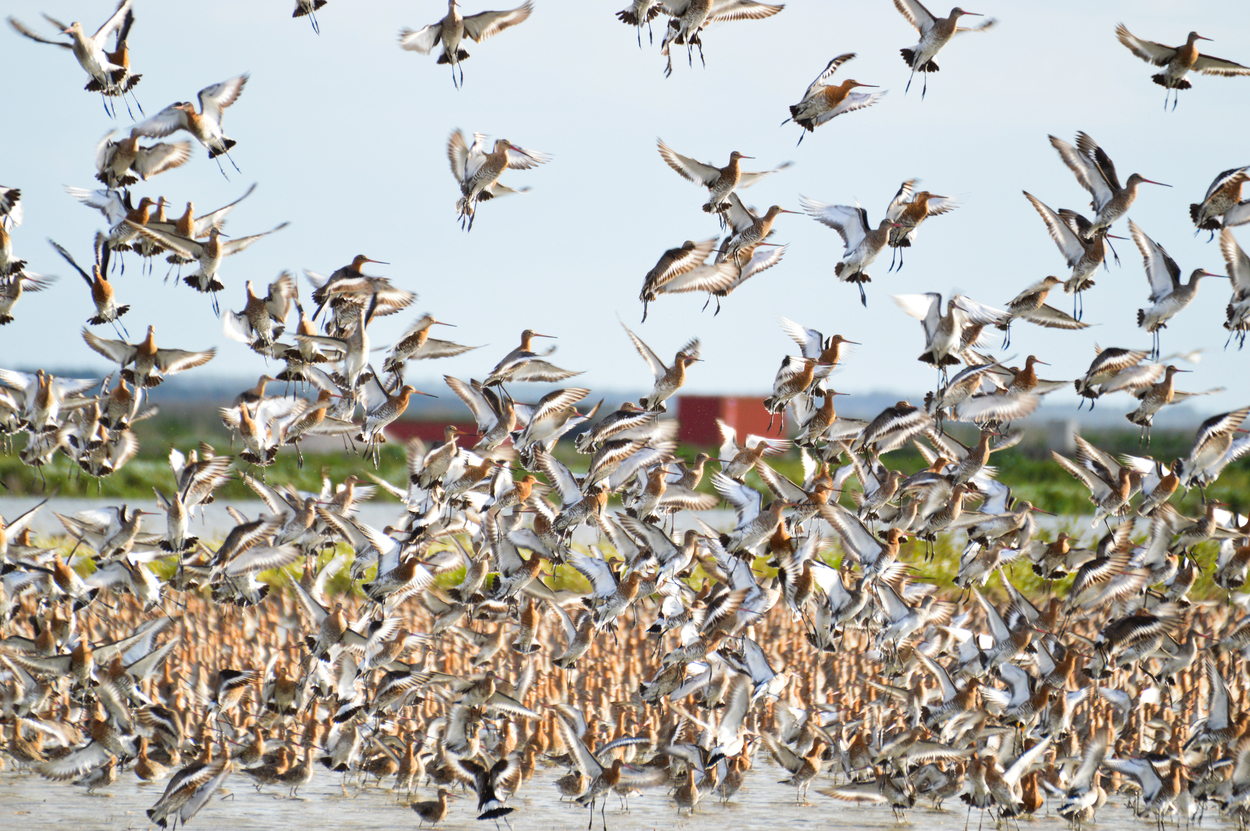
Top right: Black-tailed Godwits (Limosa limosa) © Verónica Méndez.
If you want to write about your research in #theBOUblog, then please see here.