
LINKED PAPER
Variable choice affects estimations of vulnerability to climate change. Oswald, K.N., Conradie, S.R.. 2023. IBIS. DOI: 10.1111/ibi.13281. VIEW
As the biodiversity crisis continues to grow, assessing the effects of climate change on species’ distributions, survival, and population persistence is increasingly important. This is often done by taking a threshold temperature variable where a species has shown sensitivity, and seeing how their distribution will change based on future temperature predictions (e.g. Matthewson et al. 2016). However, by including only a single response variable, are these models underestimating the risks that can come from other aspects of a species’ biology? For most species, we don’t have data on multiple areas of temperature sensitivity to examine what sort of difference would be made depending on choice of variable (or variables).
One species for which there is data showing multiple areas of temperature sensitivity is the Cape Rockjumper (Chaetops frenatus). Using data from this species, predictive modeling of “vulnerability assessment” maps could be made that clearly show how including multiple variables can help in creating a more nuanced examination of threats associated with increasing temperatures. The Cape Rockjumper has multiple life history traits that are associated with vulnerability to climate change, including a small distribution in a highly specialized habitat, and limited thermal tolerance. Here, maps were created based on two closely related variables where Rockjumper nest success was adversely affected on days with higher maximum temperatures; first, days where nestlings had a greater probability of snake predation (days > 25 °C; Oswald et al. 2020), and second, days where nestlings had reduced mass gain (days > 22.4 °C; Oswald et al. 2021).
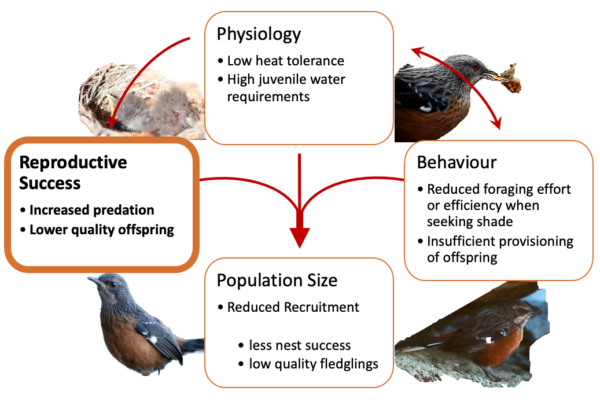
Figure 1. Overview of previous research on Cape Rockjumpers showing areas of temperature sensitivity and their interacting effects. This paper focused on two areas where temperature affected reproductive success: increased predation (on days over 25°C), and lower quality offspring (from less mass gain on days over 22.4°C).
More about the maps!
The maps were created using climate data for current (2000–2014) and future (2076–2100) climate scenarios. Climate data were obtained from the National Center for Atmospheric Research (Boulder, CO, USA) after which data were extracted for the two daily maximum temperature thresholds (25 and 22.4 °C). The current climate scenario used data from 2000–2014 available from the National Oceanic and Atmospheric Administration, while the future climate scenario used climate data from an experimental climate projection model for 2076–2100 (RCP 8.5).
The current distribution range of Rockjumpers was obtained from BirdLife International and NatureServe. Since both variables are related to nesting ecology, only climate data from within the Rockjumper’s breeding season (August–December) were used. Maps were then created that showed the total number of days nestlings were at risk from increased predation (days > 25 °C), the longest period of consecutive days nestlings would have reduced less mass (days > 22.4 °C), and then a map showing the combined total days > 25 °C and the longest period of days > 22.4 °C.
What did the maps show?
Not surprisingly, there was an increase in the number of “risk days” for nestlings for both variables when examined separately, and an even greater increase in risk days when combining the effects of both variables. However, the most unanticipated finding was in where the increases in risk occurred. Mainly, it was surprising that even with two such seemingly related (and possibly even intertwined) variables, there was a large geographic distance between where nesting Rockjumpers were likely to feel the worst effects of climate change that changed based on which variable was used. Specifically, while the eastern sections of the Rockjumper’s distribution showed the greatest increase in risk days for nestling reduced mass gain, the northwest portion of their distribution showed the greatest increase in days nestlings are at risk of snake predation.
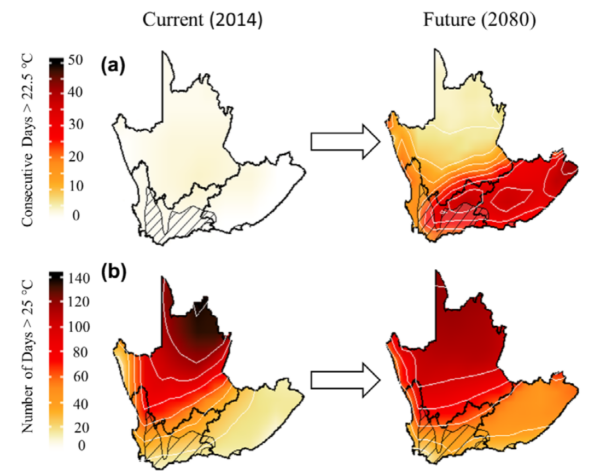
Figure 2. Maps of South Africa showing (a) the longest consecutive number of days when nestling Cape Rockjumpers have reduced daily change in mass (days > 22.5 °C) and (b) the total number of days with greater probability of nest predation (days > 25 °C). Maps show current (2014) and future (2080) climate scenarios, with the current Rockjumper distribution indicated with cross-hatching in the southwest corner.
What are the implications?
Choosing which variable to use in predictive models may be tricky but is extremely important, and where possible multiple variables should be included. In this case, only two (possibly synergistic) variables were chosen, and yet they resulted in quite different vulnerability assessment. This could obviously have serious implications for conservation efforts, as choosing where to place already limited resources is one of the most constant issues facing conservation management. Here, using the threshold value for snake predation would see resources focused in the northwest, while that of reduced nestling mass gain would see resources focused in the east.
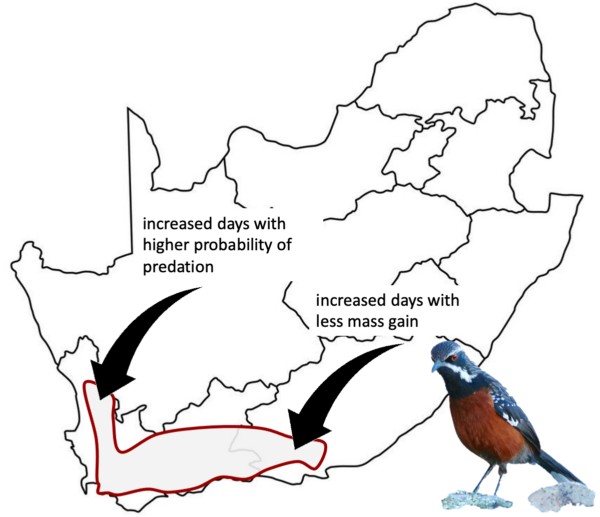
Figure 3. Map of South Africa showing the difference in where resources should be focused within the Cape Rockjumper’s distribution depending on which variable was chosen for our predictive maps.
While this sort of study cannot be done for every species, it perhaps makes a case for choosing a few representative species as indicators for adverse effects of climate change. Here, the case of the Rockjumper could be used to direct efforts for other species with similar niches (e.g. range-restricted mountain birds), or species restricted to the same habitat as the Rockjumper (e.g. other fynbos endemics). While creating multi-variable maps may not always be feasible, it is always enlightening, and worthwhile when possible.
References
Mathewson, P.D., Moyer-Horner, L., Beever, E.A., Briscoe, N.J., Kearney, M., Yahn, J.M. & Porter, W.P. 2016. Mechanistic variables can enhance predictive models of endotherm distributions: the American pika under current, past, and future climates. Global Change Biology 23:1048-1064. VIEW
Oswald, K.N., Diener, E.F., Diener, J.P., Cunningham, S.J., Smit, B. & Lee, A.T. 2020. Increasing temperatures increase the risk of reproductive failure in a near threatened alpine ground-nesting bird, the Cape Rockjumper Chaetops frenatus. Ibis 162:1363-1369. VIEW
Oswald, K., Smit, B., Lee, A., Peng, C., Brock, C. & Cunningham, S. 2021. Higher temperatures are associated with reduced nestling body condition in a range-restricted mountain bird. Journal of Avian Biology 52. VIEW
Image credit
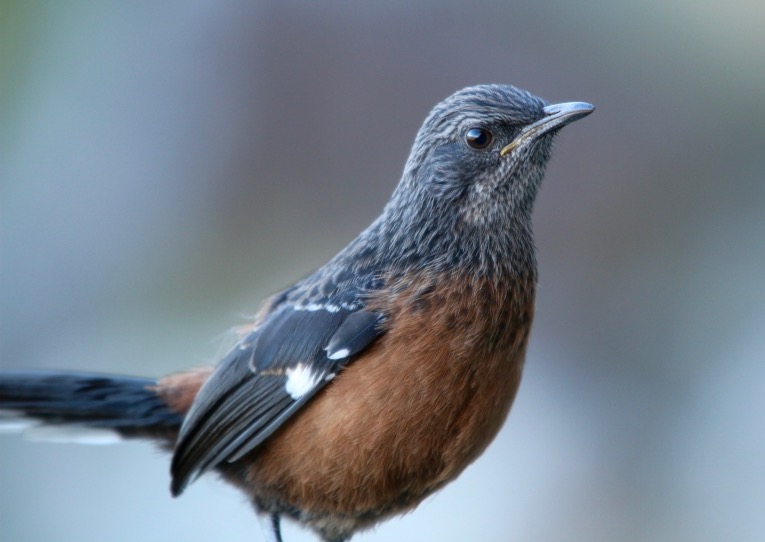
Top right: Juvenile Cape Rockjumper Chaetops frenatus © Krista N Oswald.