
A long-term mark-resight study gives insight into falling swan numbers
Kevin Wood
Wildfowl & Wetlands Trust, U.K.
LINKED PAPER
Apparent survival of an Arctic-breeding migratory bird over 44 years of fluctuating population size. Wood, K.A., Nuijten, R.J.M., Newth, J.L., Haitjema, T., Vangeluwe, D., Ioannidis, P., Harrison, A.L., MacKenzie, C., Hilton, G.M., Nolet, B.A. & Rees, E.C. 2017. IBIS. DOI: 10.1111/ibi.12521. VIEW
Over recent decades the winter counts of northwest European population of Bewick’s Swans (Cygnus columbianus bewickii) have shown a clear decline from 29,780 individuals in 1995 to 18,057 in 2010 (Rees & Beekman 2010; Nagy et al. 2012). This 39% decline in numbers has concerned conservationists, and so the Bewick’s Swan Single Species Action Plan (BSSAP) was developed under the auspices of the African-Eurasian Waterbird Agreement (AEWA) in 2012 (Nagy et al. 2012). The population is also classified as Endangered on the European Red List of Birds (BirdLife International 2015).
To understand why Bewick’s Swan numbers have changed, we need information on how the demographic or vital rates, such as productivity and survival, have changed over time. In a recent study we found no evidence that population-level productivity had fallen over time; although some very poor breeding years were evident (<5% cygnets in the over-wintering population), it appears unlikely that low breeding success could be the principal driver of the fall in population size (Wood et al. 2016). However, no information was available on the survival rates of Bewick’s Swans, or how such rates had varied over time.
In a recent study we used a data set of 3,929 individually marked Bewick’s Swans to address this key knowledge gap. We assessed trends over time and environmental drivers of survival between winters 1970/71 and 2014/2015 using a capture-mark-resight approach, whilst accounting for effects of age, sex, and different marker types (Wood et al. in press). Each swan was caught and fitted with a plastic leg ring or neck collar bearing a unique code, which allowed that individual to be identified (Fig. 1). Swans were caught and marked with leg rings in the United Kingdom (1970 onwards) and Russia (1992 onwards), whilst neck collars were fitted to swans caught in the Netherlands (1988 onwards) and Germany (1989 onwards). Our study was only possible thanks to the network of professional and amateur ornithologists across the winter range in northwest Europe, who reported their sightings of the marked birds. Of the 3,929 individuals that we marked during our study, a total of 3,079 (78.4%) were resighted in at least one subsequent winter.
 Figure 1 An adult Bewick’s Swan ready to be fitted with a plastic leg ring, which bears an unique code to allow subsequent identification of that individual © David Fotherby/WWT
Our analysis showed some support for our expectation that the Bewick’s Swans’ apparent survival rates would have varied in line with the observed population trend. By comparing different possible models of temporal variations in survival rates, we found that the trend in apparent survival rates over our study period was best explained by different survival rates for each decade. For both marker types, mean survival rates were highest in the 1980s and lowest in the 2010s. For example, mean (and 95% confidence interval) annual survival rates for adult male swans marked with leg rings was 85.2% (83.7-86.6%) and 85.9 (84.8-87.0%) in the 1970s and 1980s, respectively. Subsequently, a small decrease to 83.8% (82.6-84.9%) for adult males in the 1990s was found, which could have been sufficient to trigger the post-1995 decline in population size. The estimated survival rates showed a small increase to 84.7% (83.4-85.8%) in the 2000s, during which time the numbers on the winter grounds of northwest Europe continued to fall. However, the survival rates of the 2000s still did not reach the highs of either the 1970s or 1980s, and so the 2000s survival values may still have been below the threshold required to avoid population decline. A sharper drop in adult male survival rates to 78.3% (76.1-80.3%) was detected for the 2010s, which a model of inter-annual survival rates suggested occurred from winter 2008/09 onwards. This temporal pattern was found for all age classes and both sexes and marker types.
Age class, sex, and maker type did, however, influence the absolute values of survival. Female survival was 0.1% higher than males, whilst adults and yearlings both had apparent survival rates that were 4.6% and 5.1% higher, respectively, than cygnets. Swans marked with leg rings had apparent survival that was 4.0% greater than individuals marked with neck collars; whether this difference was due to higher rates of marker loss among birds marked with neck collars, higher mortality, an effect of winter site, or a combination of these, needs further detailed investigation.
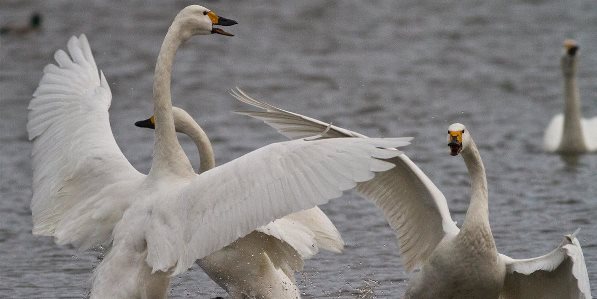
Temperature and snowfall in different areas across the flyway, winter food resources, density-dependence, and rising swan numbers at a new wintering site in south-east Europe (the Evros Delta in Greece), all performed poorly as explanatory variables of Bewick’s Swan apparent survival (Fig. 2). Of the 18 environmental variables that we tested, none accounted for more than 7.2% of the deviance associated with our survival models, with a mean of only 2.2%. In our future work we’ll be exploring the role that other factors known, such as illegal persecution, lead poisoning, habitat change, and competition with other waterbirds, might have on survival rates.
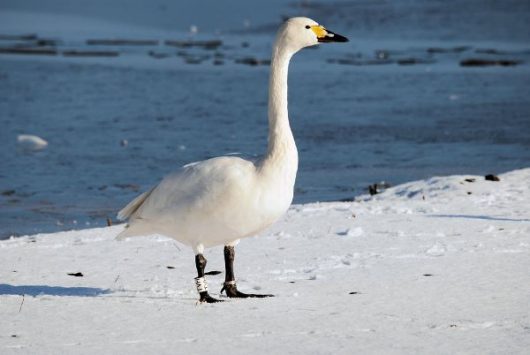 Figure 2 Bewick’s Swans face harsh weather conditions, yet the mean temperature and days of snowfall explained little of the inter-annual variation in survival © WWT
Our results provide valuable long-term demographic information needed to help us understand the population dynamics of Bewick’s Swans in northwest Europe. Survival rates typically make the largest contribution to avian population growth rates and population size for large, long-lived birds such as swans that tend to have relatively low annual productivity but high annual survival rates (Sæther & Bakke 2000; Koons et al. 2014). Indeed, several studies of congeners of the Bewick’s Swan such as the Mute Swan (Cygnus olor), have found much greater contributions of adult survival than breeding success to changes in population size (e.g. Watola et al. 2003, Ellis & Elphick 2007, Wood et al. 2013). The development of a Bewick’s Swan population model is currently underway, which will allow us to assess the relative contributions of variation in survival rates and breeding success to the observed changes in population size.
References
BirdLife International 2015. European Red List of Birds. Luxembourg City: Office for Official Publications of the European Communities. VIEW
Ellis, M.M. & Elphick, C.S. 2007. Using a stochastic model to examine the ecological, economic and ethical consequences of population control in a charismatic invasive species: Mute Swans in North America. J. Appl. Ecol. 44: 312-322. VIEW
Koons, D.N., Gunnarsson, G., Schmutz, J.M. & Rotella, J.J. 2014. Drivers of waterfowl population dynamics: from teal to swans. Wildfowl Special Issue 4: 169-191. VIEW
Nagy, S., Petkov, N., Rees, E.C., Solokha, A., Hilton, G., Beekman, J. & Nolet, B. 2012. International Single Species Action Plan for the Northwest European Population of Bewick’s Swan (Cygnus columbianus bewickii). Bonn: AEWA Technical Series No. 44. VIEW
Rees, E.C. & Beekman, J.H. 2010. Northwest European Bewick’s Swans: a population in decline. Br. Birds 103: 640–650. VIEW
Sæther, B.-E. & Bakke, Ø. 2000. Avian life history variation and contribution of demographic traits to the population growth rate. Ecology 81: 642-653. VIEW
Watola, G.V., Smith, G.C., Forrester, G.J., Coleman, A.E., Coleman, J.T., Goulding, M.J., Robinson, K.A. & Milsom, T.P. 2003. Analyses of two Mute Swan populations and the effects of clutch reduction: implications for population management. J. Appl. Ecol. 40: 565-579. VIEW
Wood, K.A., Stillman, R.A., Daunt, F. & O’Hare, M.T. 2013. Evaluating the effects of population management on a herbivore grazing conflict. PLoS One 8: e56287. VIEW
Wood, K.A., Newth, J.L., Hilton, G.M., Nolet, B.A. & Rees, E.C. 2016. Inter-annual variability and long-term trends in breeding success in a declining population of migratory swans. J. Avian Biol. 47: 597-609. VIEW
Wood, K.A., Nuijten, R.J.M., Newth, J.L., Haitjema, T., Vangeluwe, D., Ioannidis, P., Harrison, A.L., MacKenzie, C., Hilton, G.M., Nolet, B.A. & Rees, E.C. In press. Apparent survival of an Arctic-breeding migratory bird over 44 years of fluctuating population size. IBIS. VIEW

About the author
Kevin Wood is Principal Research Officer in the Conservation Science team at the Wildfowl & Wetlands Trust. His research uses statistical and simulation modelling of demographic and behavioural data to improve our understanding of waterbird populations and inform their conservation. The current focus of his research is understanding the causes behind the decline in Bewick’s Swan population size.
Follow Kevin on Twitter @DrKevinWood
Image credit
Featured image: Bewick’s Swan, Cygnus columbianus bewickii © Graham Hann/WWT
If you want to write about your research in #theBOUblog, then please see here.