 LINKED PAPER
Point count offsets for estimating population sizes of North American landbirds. Edwards, B.P.M., Smith, A.C., Docherty, T.D.S., Gahbauer, M.A., Gillespie, C.R., Grinde, A.R., Harmer, T., Iles, D.T., Matsuoka, S.M., Michel, N.L., Murray, A., Niemi, G.J., Pasher, J., Pavlacky Jr., D.C., Robinson, B.G., Ryder, T.B., Sólymos, P., Stralberg, D., & Zlonis, E. 2022 Ibis. doi: 10.1111/ibi.13169 VIEW
Behind most estimates of trend, density, or population size of a given bird species is one or more bird surveys conducted to gain the necessary information. For landbirds, a common method of surveying birds is through point counts, whereby an observer stands at a location for several minutes and records all birds that they can see or hear within that time frame.
If the observer records the time at which they first detected an individual throughout their survey, then they can use removal modelling to gain an estimate of cue rate, which is the rate at which a bird gives a cue (like singing) per unit time. Additionally, if the observer records all distances to recorded birds throughout their survey, then they can use distance modelling to gain an estimate of detection distance, which is distance at which a human observer can detect a singing bird. Cue rate and detection distance can then be used to generate estimates of availability and perceptibility, respectively. Availability describes the probability that a bird will give a cue during a given survey, and perceptibility describes the conditional probability that observer records the bird, given the bird gives a cue (Sólymos et al. 2013).
When considered together, availability and perceptibility describe the overall detectability of a bird. Over the last decade, several methodologies have been developed to estimate detectability of different bird species. One such method is the QPAD method (Sólymos et al. 2013), which is flexible model that generates estimates of availability and perceptibility by allowing multiple different types of surveys to be jointly modelled. That is, as long as a survey contains some information about time to first detection, it can be used to model availability; and, as long as a survey contains some information about a bird’s distance from the observer, it can be used to model perceptibility. This flexibility in modelling detectability means that we can try to generate detectability estimates for as many species as we can possibly find data for.
The NA-POPS project was created with exactly that goal in mind: to take advantage of all of the open-source bird monitoring datasets across Canada and the US, and generate detectability estimates for as many North American landbird species as possible. This collaborative project is made up of scientists across several government agencies, universities, and conservation organizations across Canada and the US. Through a collection of data-sharing agreements, and with the help of data harmonization methods developed by the Boreal Avian Modelling project (Barker et al. 2015), NA-POPS was able to curate over 7 million datapoints from across the continent from over 290 projects (Figure 1). These data were then used to generate detection probabilities for over 300 species of landbirds that breed in North America.
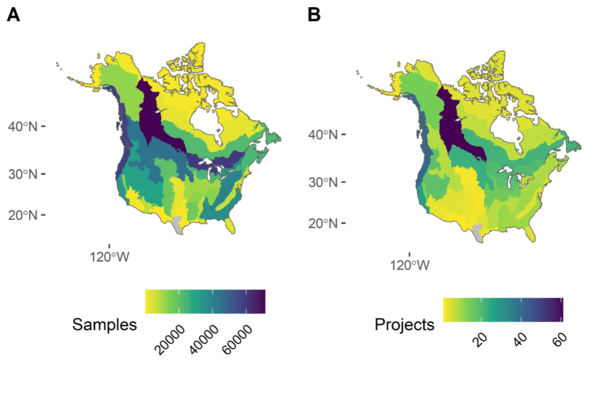
Figure 1 Spatial coverage map of all sampling events considered in the analysis of this paper (a), and number of individual projects that contributed data to each stratum (b), stratified by Bird Conservation Region (BCR). Grey regions indicate no data (BCR 20: Edwards Plateau, and BCR 36: Tamaulipan Brushlands).
Variation in detectability in space and time
Because of the abundance of data available to us, we were able to generate estimates of detection probability that were able to vary based on effects of time and environmental conditions. It is well known that for most bird species, the rate at which the bird is giving a cue is going to be much higher during the dawn chorus (i.e., time since sunrise) and during peak breeding dates (i.e., ordinal day/day of the year) (Wilson and Bart 1985). Additionally, several studies have shown the effects of forest coverage and roads on humans’ ability to hear singing birds (e.g., Schiek et al. 1997, Yip et al. 2017). In general, the more vegetation (i.e., higher proportion of forest coverage), the harder it is to hear a singing bird due to sound being absorbed or scattered. For roads, singing birds may be easier to hear near a roadside because sound waves actually bounce off the hard surface of the road, allowing the sound waves to travel further.
With this information in mind, for each species considered in NA-POPS, we modelled the species’ availability by effects of time since sunrise and ordinal day (as well as quadratic terms), and we modelled perceptibility by effects of forest coverage and roads (including an interaction term). For most species, model selection tended to favour models that contained a combination of one or more of these covariates for each of the estimates of availability and perceptibility. That is, unsurprisingly, most species’ availability was affected by some combination of time since sunrise and ordinal day, and most species’ perceptibility was affected by some combination of forest coverage and roadside status (Figure 2).
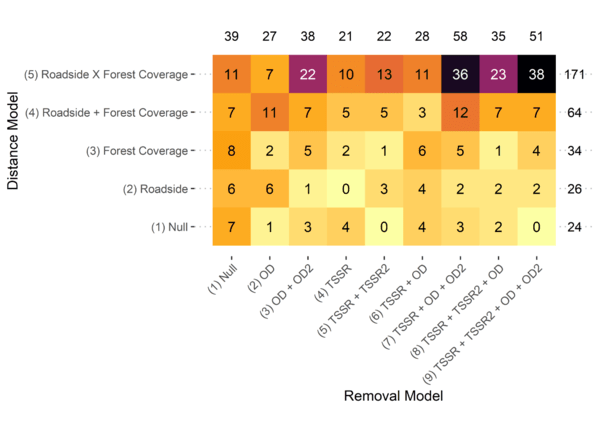
Figure 2 Heatmap of model selection (chosen by AIC) for species that had sufficient data for both removal and distance modelling. Numbers inside squares indicate the number of species that had that particular removal model/distance model combination selected. Numbers in the margin are total number of species for that particular removal model or distance model.
Given these results, we can then look at individual species to see the particular effects of these covariates on their detectability. For example, in the American Robin (Turdus migratorius), we see that availability tends to peak in June and shortly before sunrise (Figure 3). When considering perceptibility, we see that we can generally detect American Robins slightly better off-road than on-road when we are in a forest, whereas that pattern flips in a non-forested area (Figure 4).
Conservation Implications
Detection probabilities for species show up in numerous conservation decisions, from estimating densities of a species to making decisions about where to monitor and where to act. Often, for species where detection probabilities are not empirically known, a range of detection probabilities are used in models. Depending on how certain (or uncertain) the modeller is, this range of detection probabilities can have downstream effects of creating a large range of potential population size estimates, or a poor decision about whether or not to monitor an area for a species at risk based on current information. As such, it is imperative to have detection probabilities that are as accurate and precise as possible.
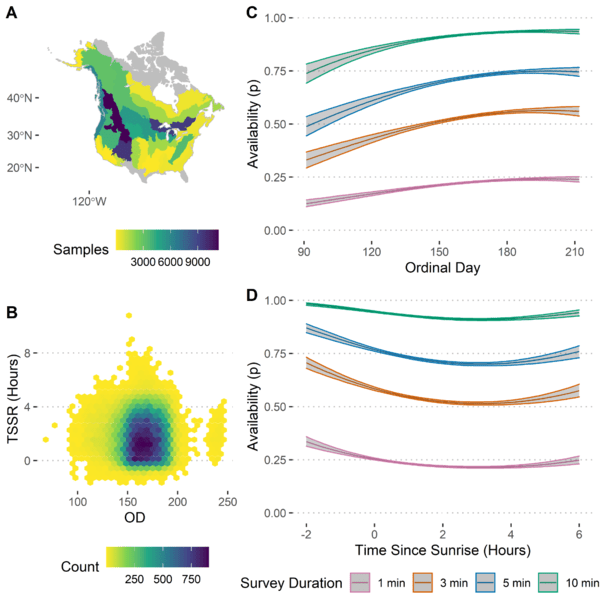
Figure 3 Summary of removal modelling for American Robin (Turdus migratorius) (n = 72,620), including (a) spatial coverage of removal sampling, (b) covariate space for ordinal day and time since sunrise, (c) predicted probability of availability against ordinal day for surveys of 1, 3, 5 and 10 min in duration, and (d) predicted probability of availability against time since sunrise for surveys of 1, 3, 5 and 10 min in duration.
NA-POPS represents a data-driven solution to estimating detection probabilities for a taxon on a broad scale. That is, given the huge amounts of bird monitoring data available, NA-POPS was able to generate detection probabilities for over 300 species of landbirds. For these 300+ species, estimates of population size could improve because we can now use these empirically-derived estimates of detectability, rather than our “best guess”. This has huge conservation implications for managing population sizes in rare species. Additionally, because detectability can be used to translate bird surveys from recorded counts to estimated densities (or estimated abundance), the detectability estimates from NA-POPS can be used in large-scale data integration exercises to improve accuracy and precision of trend estimates from current gold-standard monitoring programs like the North American Breeding Bird Survey.
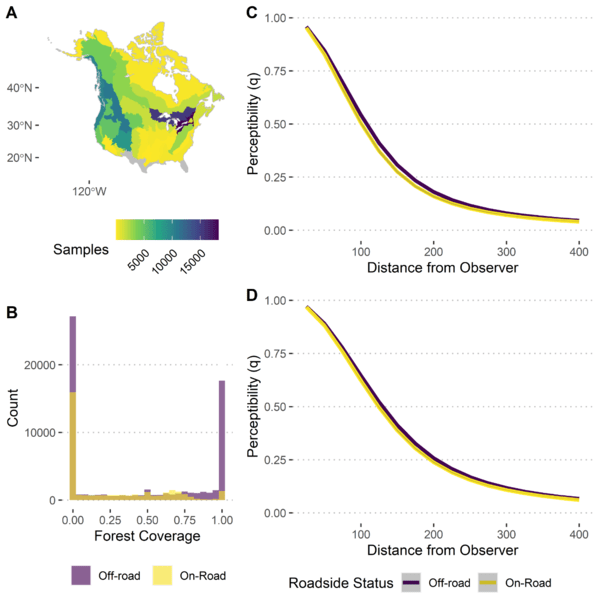
Figure 4 Summary of distance modelling for American Robin (Turdus migratorius) (n = 98,775), including (a) spatial coverage of distance sampling, (b) covariate space for forest coverage and roadside status, and predicted perceptibility against distance from observer for off-road and on-road surveys in (c) forested environments and (d) non-forested environments.
Open and Accessible Science
NA-POPS provides the estimates of detectability free to anyone through the R package napops (https://github.com/na-pops/napops), or through an interactive results dashboard (https://cons.carleton.ca/napops-dashboard/). We hope this will allow other researchers to explore the estimates generated by NA-POPS and openly scrutinize the estimates for future improvements. Additionally, we invite researchers with point count datasets to contribute their data to NA-POPS for species or areas of North America that may be under sampled.
Image credit
Top right: Prairie Warbler (Setophaga discolor) © Brandon P.M. Edwards.
If you want to write about your research in #theBOUblog, then please see here.