 LINKED PAPER
The relationship between Mute Swan Cygnus olor population trends in Great Britain and environmental change. Ki, T.L.T., Pain, D.J., Gill, J.A., Green, R.E. 2023 Bird Study. DOI: 10.1080/00063657.2023.2239554 VIEW
Identifying the drivers of population change is critical for species conservation, but multiple drivers often act simultaneously making them hard to tease apart. British Mute Swan numbers declined in the 1960s and remained at low numbers in 1970s, but have since more than doubled. We used spatial and temporal variation in population change to investigate the factors that could have led to this increase.
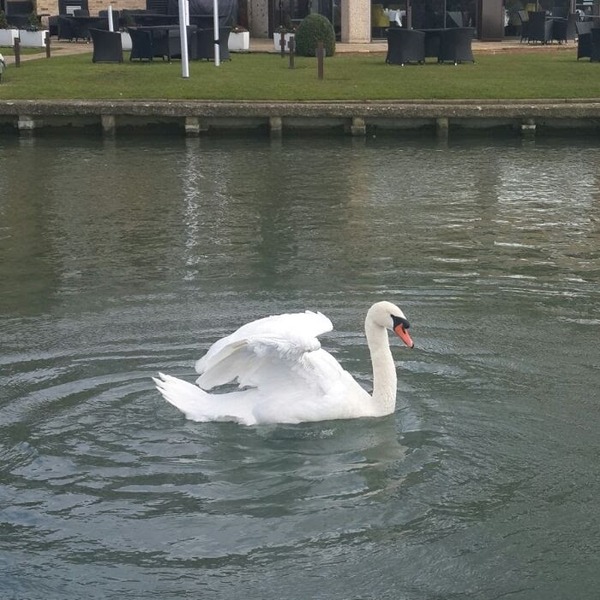
Figure 1 Mute Swan © Tiffany Ki.
The Context
Declines in the 1960s were probably the result of increased mortality with severe winters, yet Mute Swans remained in low numbers throughout the 1970s. Much research and examinations in the 1980s linked the high mortality in Mute Swans to ingestion of lead fishing weights in waterways and waterbodies (e.g. Birkhead & Perrins 1985). Lead fishing weights were common as they were accidentally deposited from coarse fishing and the foraging behaviour of Mute Swan’s meant they came across these weights frequently. Considerable evidence led to the national ban on lead fishing weights in 1986, and since then, Mute Swan numbers have increased, the incidence of lead poisoning found in Mute Swans has decreased and the proportion of deaths attributable to lead poisoning has decreased (e.g. Sears & Hunt 1991).
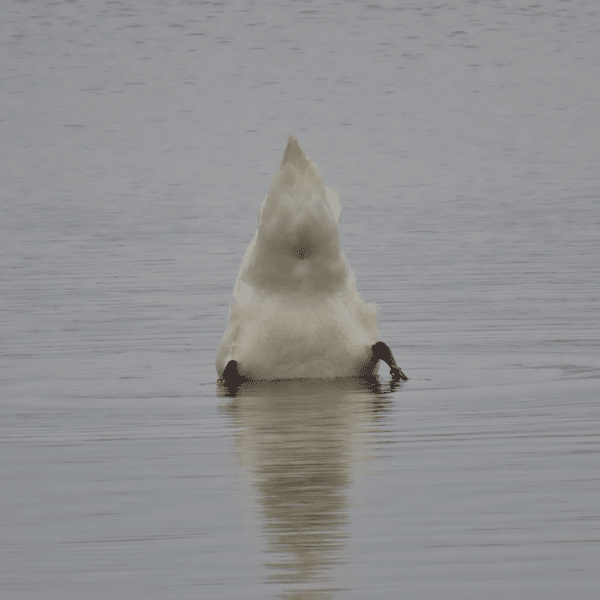
Figure 2 Up-ending swan © Shuyu Deng.
The population recovery of Mute Swans has been largely attributed to the success of the ban, but there are indications that other factors might also play a role in the story. The rapid decline in blood lead levels of Mute Swans after the ban did not continue beyond the early 1990s, yet swan numbers continued to rise (Perrins et al. 2003). This period has also seen warmer winters, increases in autumn-sown crops and improvements in waterway quality, all factors that might have contributed to their population increases (e.g. Rowell & Spray 2004).
Our Study
To investigate the likely factors that contributed to these population increases, we analysed spatial and temporal variation in Mute Swan numbers with environmental variables. In addition to increasing significantly across time, Mute Swan population change also varied significantly across space. We found that some regions showed a seven-fold increase from pre-ban numbers, whilst others showed a 15% decrease. Our analyses of temporal and spatial variation indicated that the increase in autumn-sown crops, particularly wheat and oilseed rape, was mostly strongly associated with the increase in Mute Swan numbers.
The shift from spring to autumn-sowing of cereal crops is one of the major post-war changes in farming practices in Britain. The increased winter food resources likely improved survival and breeding productivity of the Mute Swans, and may have decreased food-stress, with type, amount and physical composition of food possibly influencing the effect of the ingested lead.
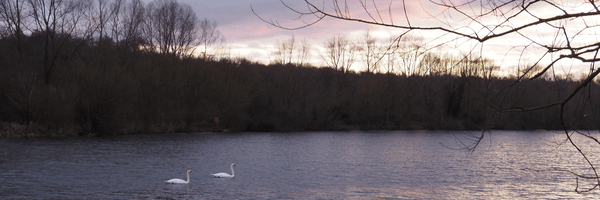
Figure 3 Mute Swans on Lake © Tiffany Ki.
Conclusion
The British Mute Swans likely benefitted from both the increased winter food resources (provided by the shift from spring to autumn-sowing of cereal crops) and reduced lead ingestion (from the 1986 ban on lead angling weights). These changes allowed their population numbers to more than double at the national level, with some regions even showing a seven-fold increase since the pre-ban era. Our study suggests a strong link between autumn-sown crops and Mute Swans, and indicate the likely influence of future changes in agricultural policy and policy.
References
Birkhead, M., Perrins, C. 1985. The breeding biology of the Mute Swan Cygnus olor on the River Thames with special reference to lead poisoning. Biological Conservation 32:1-11. VIEW
Sears, J., Hunt, A.E. 1991. Lead poisoning in Mute Swans Cygnus olor in England. Wildfowl S1:3383-388. VIEW
Perrins, C.M., Cousquer, G., Waine, J. 2003. A survey of blood lead levels in Mute Swans Cygnus olor. Avian Pathology 32:205-212. VIEW
Rowell, H., Spray, C. 2004. Mute Swan Cygnus Olor (Britain and Ireland Populations) in Britain and Northern Ireland 1960/61 – 2000/01. Wildfowl & Wetlands Trust/Joint Nature Conservation Committee Report. VIEW
Image credit
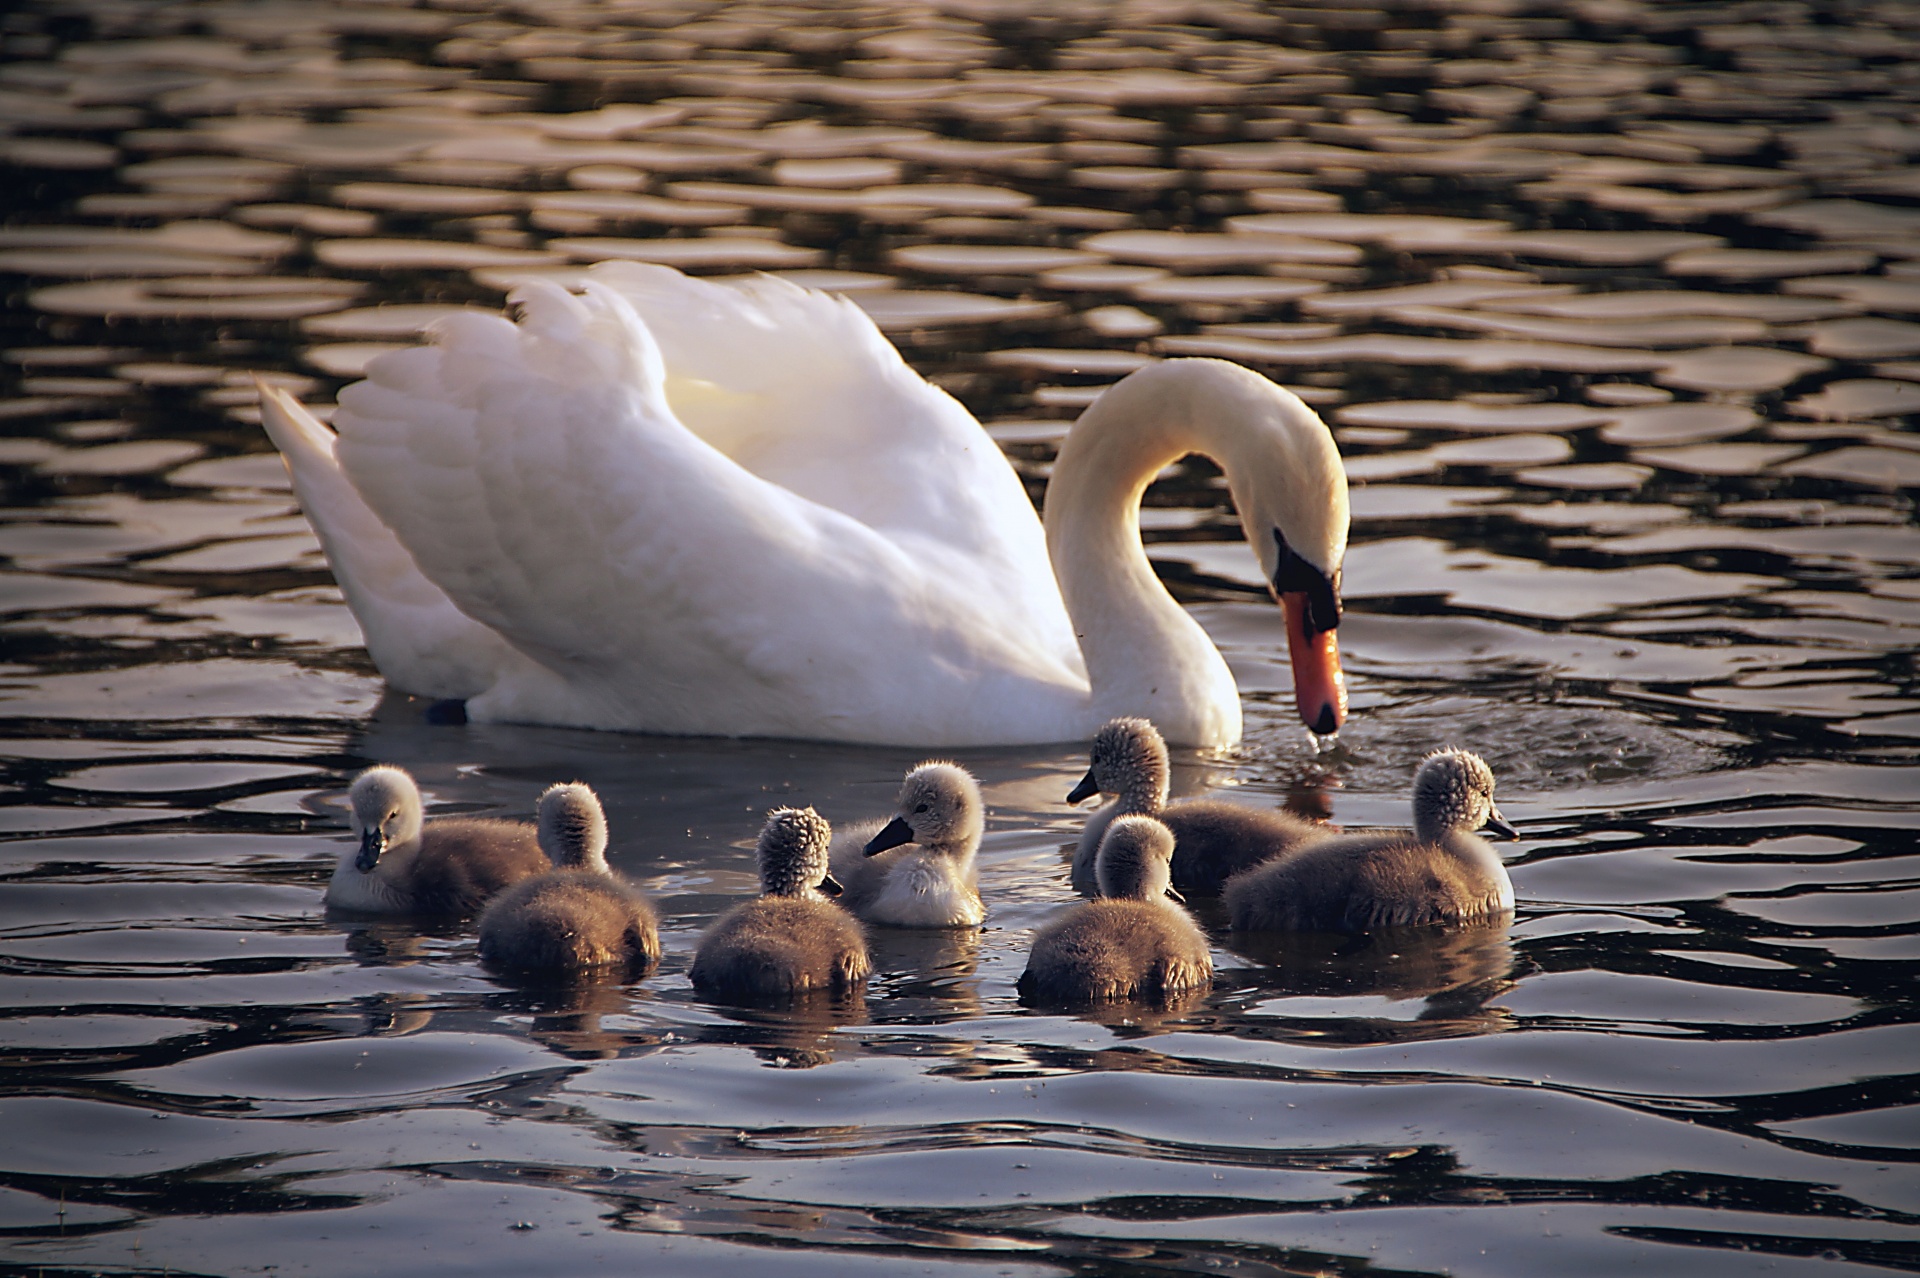
Top right: Mute Swan and cygnets © Andrea Stöckel CC0 1.0 Universal.
If you want to write about your research in #theBOUblog, then please see here.

