Interested in how and why birds diversified? Help us to understand the diversity of the world’s 10,000 bird species.
The Mark My Bird team
Department of Animal and Plant Sciences,
University of Sheffield, UK
The 10,000 species of bird alive today are found globally in nearly every terrestrial environment, and range in size from the tiny bee hummingbird to the ostrich.
From the echolocation of the oilbird to the intricate dances of manakins, birds exhibit a variety of fascinating behaviours, as well as a startling array of beak shapes. Recent scientific advances have allowed us to draw evolutionary relationships representing the family tree of all living birds (Birdtree, Jetz et al. 2012), and soon genetic data will be available for all bird species (Bird 10K project, Jarvis et al. 2014). This means we can start to delve deeper, and investigate how the patterns of avian biodiversity we see today have arisen across the entire class.
Biodiversity encompasses all of the ecological, morphological, and behavioural traits that characterise a species. One particularly interesting and important trait is the morphology of the bill. This structure is a highly adaptable tool that can tell us a lot about the ‘ecological niche’ of a species – the role an animal plays in its environment, such as what it feeds on and how it forages. A classic example of the importance of bird bills is the spectacular adaptive radiation of the Hawaiian honeycreepers. The size and shape of honeycreeper bills is staggering, with different species resembling anything from parrots to finches and warblers. Each bill is beautifully adapted to a specific ecological niche and allows each species to exploit different resources compared to its relatives. Evolving into these different niches may be a key step in the origin of species.
Although the Hawaiian honeycreepers exhibit extraordinary bill diversity, the diversity across all birds is even more astounding. Understanding bird bill evolution can help us reveal the processes that have led to the 10,000 species of birds we see today. This is exactly what our team of researchers at the University of Sheffield is investigating. We want to know how, why and when bill diversity arose. Why are some bird families so spectacularly diverse in bill shape whereas others are not? When did the extremes of bird bill diversity arise? What can bill evolution tell us about the origin of species? These are challenging questions to answer and they require a huge amount of data. We hope you can help by joining in with a new citizen science project: www.markmybird.org.

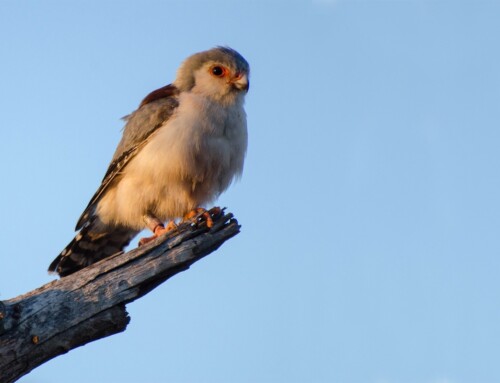
(© Dick Daniels). All images licensed under CC BY-SA 3.0.
3D Scanning and Geometric Morphometrics
The aim of markmybird.org is to measure bill shape from every one of the world’s 10,000 bird species. When studying living birds in the field, measurements such as length, depth, and width are typically taken using calipers. These linear measurements are of great value but do not tell us everything about the shape of the bill. Bird bills vary in curvature and often have other odd characteristics, such as the casques (helmet-like structures) of hornbills and the ‘spatula’ at the beak tips of spoonbills and spoonbill sandpipers. Features such as these are completely missed when taking standard linear measurements, and could potentially be important sources of variation when studying bird bill shape evolution.
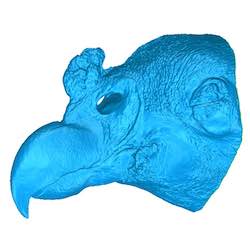
One way we can capture the shape of a bird’s bill in its entirety is to generate a digital model using a 3D scanner. 3D scanning works by combining a series of images taken from multiple angles into a single 3D scan that is essentially a big data file with millions of X-Y-Z coordinates.

Our research team based at the University of Sheffield is currently generating 3D scans of the bills from each of the world’s living bird species. It would not be possible to do this in the field – the birds need to be absolutely still for each scan. And of course even seeing every bird species in the world is not an easy task! Instead we use study skins from natural history collections. We began work in late 2014 and have used collections at the Natural History Museum at Tring and the Manchester Museum. The bird collection at the NHM Tring is among the largest in the world and includes specimens of an incredible 95% of all of the world’s living bird species – it is a real privilege to be able to work there. Working with museum collections and 3D scanners means that we can measure shape in great detail. So far, we have scanned over 4,000 species’ beaks, some of which can be viewed on our gallery.
The scans are beautifully detailed and capture almost every aspect of the beak’s shape. But how do we get from a complex 3D scan with millions of data points to a measure of bill shape that can be compared from one species to the next? This involves a process called landmarking. A landmark is simply a feature of the bill that is common to all specimens, like the bill tip for example. It is possible to reduce a bill to just a few tens of landmarks and still describe its shape. Our team is scanning all 10,000 species of birds. This will release a huge amount of information stored in our museum collections. Each one of the 10,000 scans has to be landmarked not once, but at least three times so that we can account for any human error. However, landmarking such a large amount of information is no small matter! This is where markmybird.org comes in and where you can help.
The Power of Crowdsourcing: Mark My Bird
The Mark My Bird project launched this week after months of work by the talented team at HRI digital and testing by family, friends and colleagues. The idea behind markmybird.org is that anyone can be a citizen scientist and so anyone from anywhere in the world can help by landmarking scans. Every landmarked scan is a vital piece of information that can help address how and why bills diversified, and together this data will allow us to better understand the diversity of birds. All of the data collected through markmybird.org will be uploaded to the Natural History Museum’s Data Portal. This is really important because the Data Portal is an open access resource meaning that anyone can access and use the data.
Over at markmybird.org you will find more information about the project, a gallery of 3D scans and most importantly the landmarking app where you can help us to build the most comprehensive data set of bird bills ever attempted. If you love birds, the scans themselves are particularly interesting as you can view the beaks of many species up close – something that is not always possible when looking through binoculars! You can follow links to find out more about the evolutionary relationships of birds at the marvelous OneZoom site. You can even compete with other citizen scientists to climb the landmarking leaderboard and earn badges to track your landmarking progress. By harnessing the power of amateur and expert birders alike, we can shed light on how and why the 10,000 species of bird diversified. We hope that you give it a go; it’s really good fun!
References and further reading
Bird 10K Project View
Birdtree: A global phylogeny of birds View
Capp, E. 2015. Applications for 3D scanning and printing. View
GrrlScientist. 2011. Hawaiian honeycreepers and their tangled evolutionary tree.
The Guardian View.
Jarvis, E.D., Mirarab, S., Aberer, A.J., Li, B., Houde, P. et al. 2014. Whole-genome analyses resolve early branches in the tree of life of modern birds. Science, 346: 1320-1331. View
Jetz, W., Thomas, G.H., Joy, J.B., Hartmann, K. & Mooers, A.O. 2012. The global diversity of birds in space and time. Nature, 491: 444-448. View
About the author

View the Thomas lab research group website
Follow the research group on Twitter @MacrobirdEvol
Image credits
Featured image – King Vulture 3D Scan © Natural History Museum, London; Mark My Bird! Illustration © Jen Bright
If you want to write about your research in #theBOUblog, then please see here.


