
LINKED PAPER
Sensitivity of migratory connectivity estimates to spatial sampling design. Vickers, S.H., Franco, A.D.A. & Gilroy, J.J. 2021 Movement Ecology. DOI: 10.1186/s40462-021-00254-w VIEW
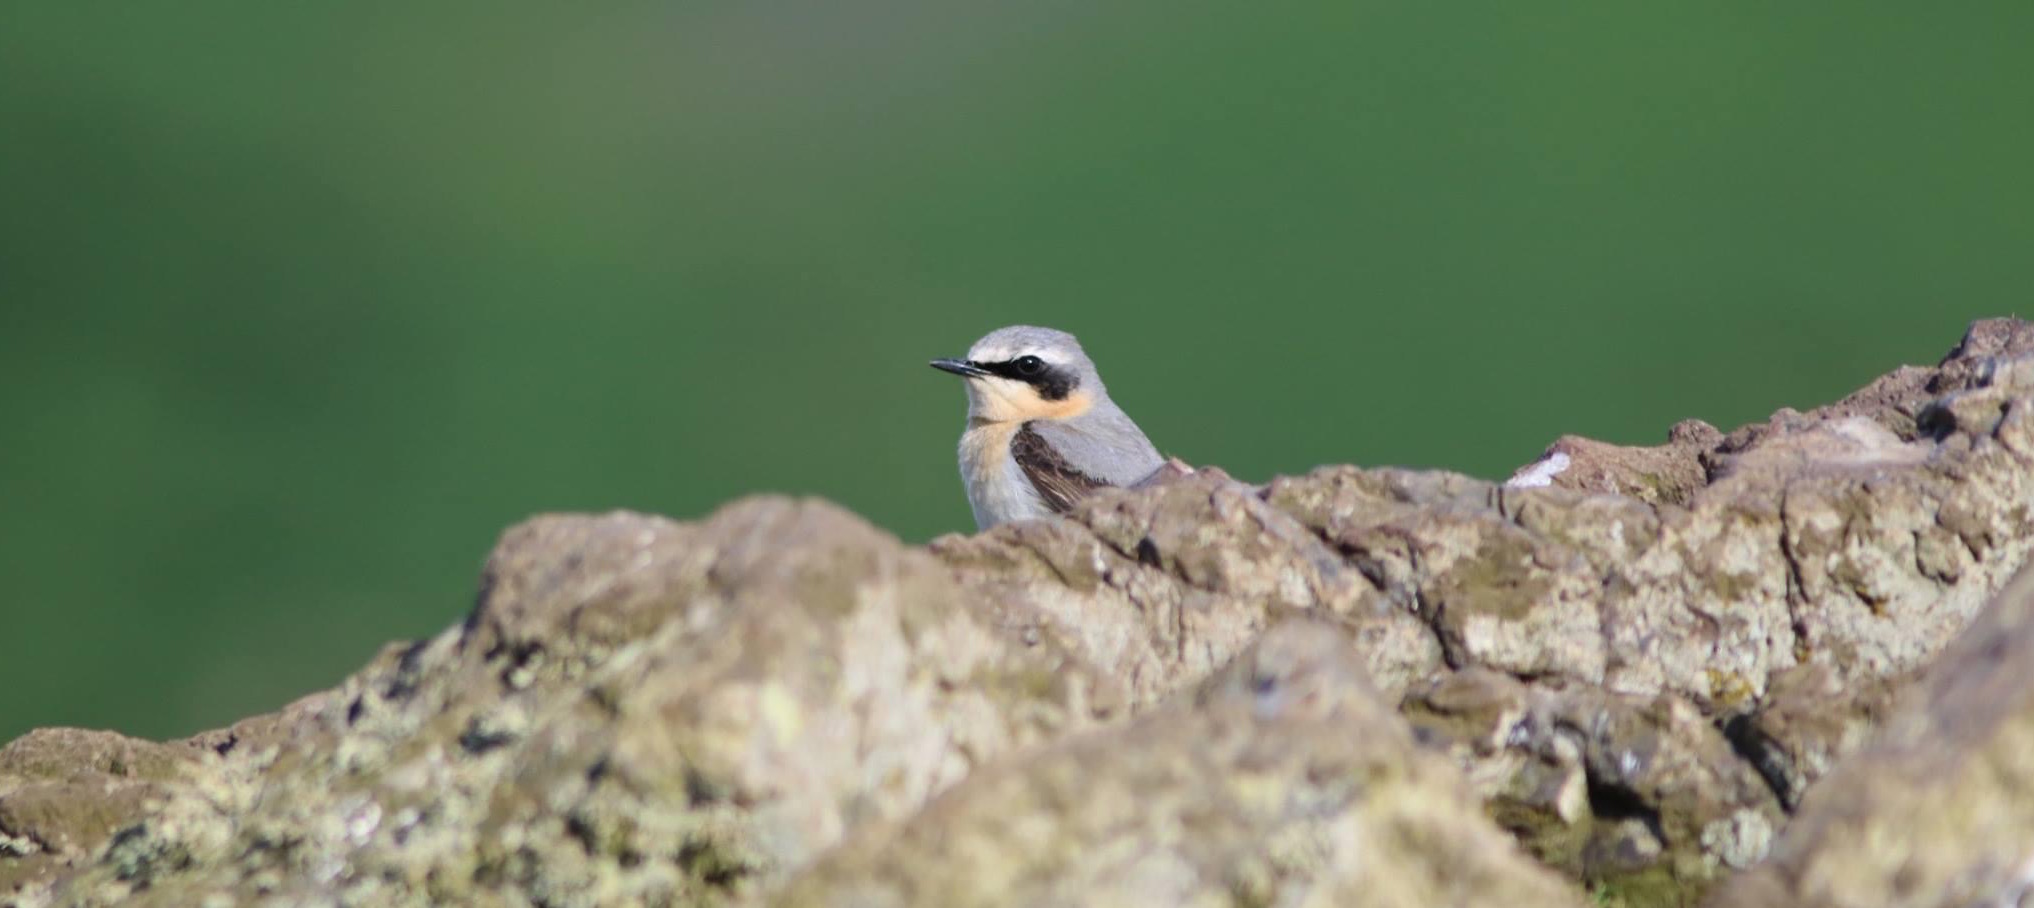
 Few natural phenomena capture the imagination quite like the annual migration of birds worldwide. We have known of these great movements for thousands of years, yet we still have much to learn of the incredible complexity of this process. How is it that a ~25g Northern Wheatear can find its way across thousands of kilometres from where it was born to its wintering grounds having never been there before? And how strong are the links between these periods of the annual cycle?
Migratory connectivity describes the linkage between migrants’ seasonal ranges at the population scale, most often between breeding and non-breeding grounds. With stronger migratory connectivity, your neighbours in one time period are likely to be your neighbours in another. Weaker migratory connectivity, on the other hand, occurs when there is more mixing between periods, for example a bird that bred in Britain may find itself wintering next to a bird that bred in Russia. Understanding the strength of connectivity can be important in effective conservation planning of migratory species. Populations with strong migratory connectivity may require more localised targeted conservation efforts across the seasons to conserve declining sub-populations. Conversely, populations with weaker migratory connectivity may require diffuse conservation action across their entire range.
Being able to put a simple numerical value to a complex spatial pattern such as this is appealing to scientists, as they may facilitate comparisons between species and be easily communicated. The most commonly used statistical method are Mantel correlations. Measured on a scale from -1 to 1, Mantels are a correlation between the pairwise differences of individuals in one period and the corresponding pairwise distances in a second period. A score of 1 would be perfect connectivity; an individual’s relative distance to all other individuals is maintained in both periods. A score of 0 would be complete random mixing. Recent advances in statistical methods of calculating migratory connectivity strength have dealt with issues such as location uncertainty from tracking devices (e.g., geolocators) and imbalanced sampling with respect to local abundance (Cohen et al., 2018); however, this extension of the Mantel method has data requirements that can be hard to meet. Because of this, reliance on the Mantel statistic is still commonplace.
We developed simplified simulated migratory populations to test how spatial sampling can introduce bias to Mantel statistics, and illustrate the underlying mechanisms of these biases. We then used more realistic simulated migratory populations based on the real-world ranges of Bachman’s Sparrow, Aquatic Warbler, and Falcated Duck (covering three major flyways and variation in range shape) to explore how ornithologists can best organise their field sampling to minimise spatial biases in practice.
Migratory connectivity is scale dependent
When we sample a population, for example by tagging birds on the breeding ground with geolocators or GPS loggers (as is common practice), we artificially restrict the maximum pairwise distances that can be observed between tagged individuals in that season (i.e., we’re unlikely to observe them further apart than are most distant sampling sites). When we then compare these distances to equivalent measurements between the sites the birds use on the non-breeding grounds, the latter measures are free from the any artificial restrictions (i.e., migratory individuals can go wherever they want and still be included in our metric, as long as the tracking data is recovered). This is the fundamental mechanism that drives bias in measures of migratory connectivity. In our simulations, even a uniformly distributed population governed by the same processes giving rise to between-season mixing, showed clear evidence of scale-dependence in connectivity scores (i.e., the score you get depends on the spatial scale of monitoring, not just the underlying biology of the species).
This further strengthens the argument put forward by Finch et al., 2017 that these measures should be combined with a measure of population spread, as the MC value by itself may be fallible.
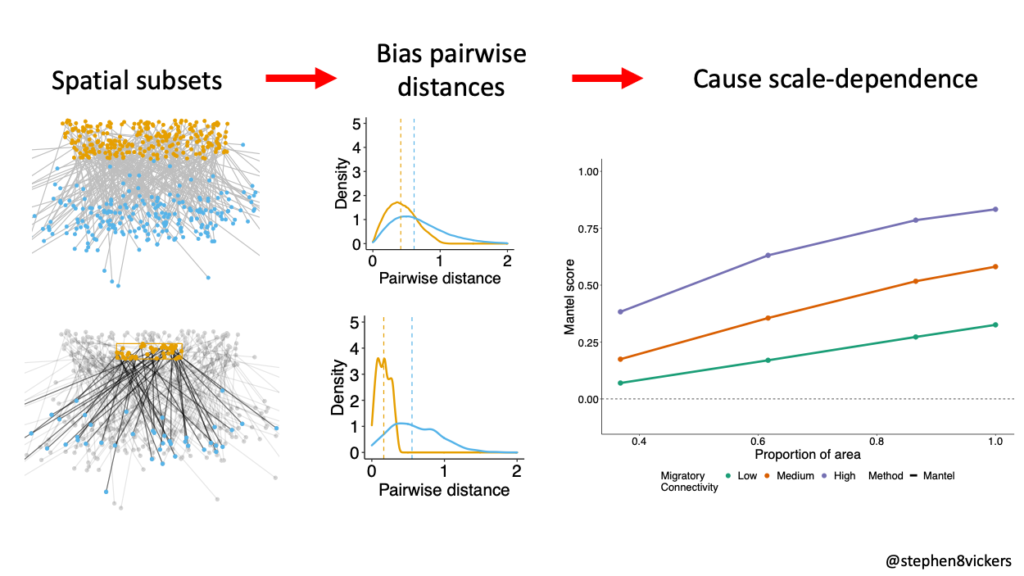 Figure 1 When sampling of individuals is restricted to smaller spatial subsets of a population, pairwise distances between individuals are biased compared to the wider population. This in turn creates scale-dependency in Mantel metrics.
Random spatial sampling can work, but discrete sampling sites introduce bias
Our simulations showed that if you randomly sample individuals across the full species range you want to measure, you can produce unbiased estimates of MC, so long as you don’t then use the metrics to infer something about a population with a larger extent. Often however, researchers choose to sample in discrete sampling sites. In this case, you further bias the pairwise distances between your sampled individuals. Pairwise distances are restricted to those within and between your sites. These ‘forced’ restrictions to observable pairwise distances can make the sampled individuals appear more spatially distinct than the wider population – this can drive overestimation of true connectivity.
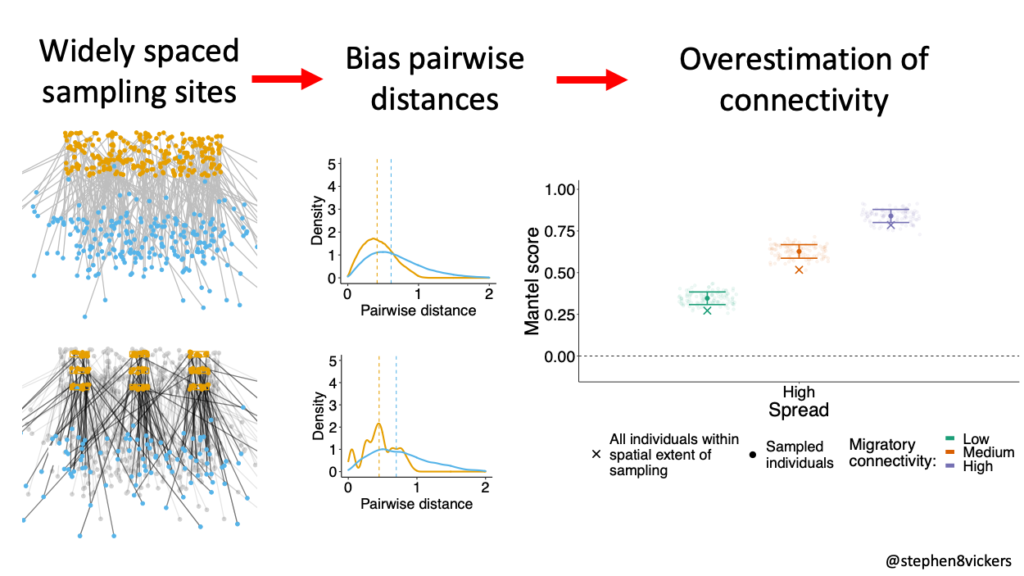 Figure 2 When sampling is undertaken across multiple discrete sites, the spacing between sites can bias pairwise distances between individuals compared to the wider population. This can drive overestimation of connectivity.
So how should we sample?
If you can, random sampling across the entire range of your population is the way to go, but in all likelihood that will be impossible to achieve for most researchers. That’s particularly the case for tracked birds where we must retrieve the tag to get our tracking data; good luck retrieving those tags if your sampling was over large spatial scales! So, we are usually restricted to sampling sites, and we tend to pick areas of highest density of our species as this improves our trapping and re-trapping probabilities.
Our simulations showed that with a limited number of tracking devices for deployment, researchers can improve precision in MC scores by maximising the number of discrete sampling sites used. The distribution of these sampling sites also matters: the sites should ideally be well distributed across the population you wish to measure. Failure to cover the extent of your population will introduce scale-dependence, and you will tend to underestimate MC. Introduce too large gaps between your sites, however, and you risk overestimating connectivity! This is a difficult, situation-dependent, balance to strike but understanding the mechanisms of such biases will help researchers limit the bias and understand the potential weakness in these measures.
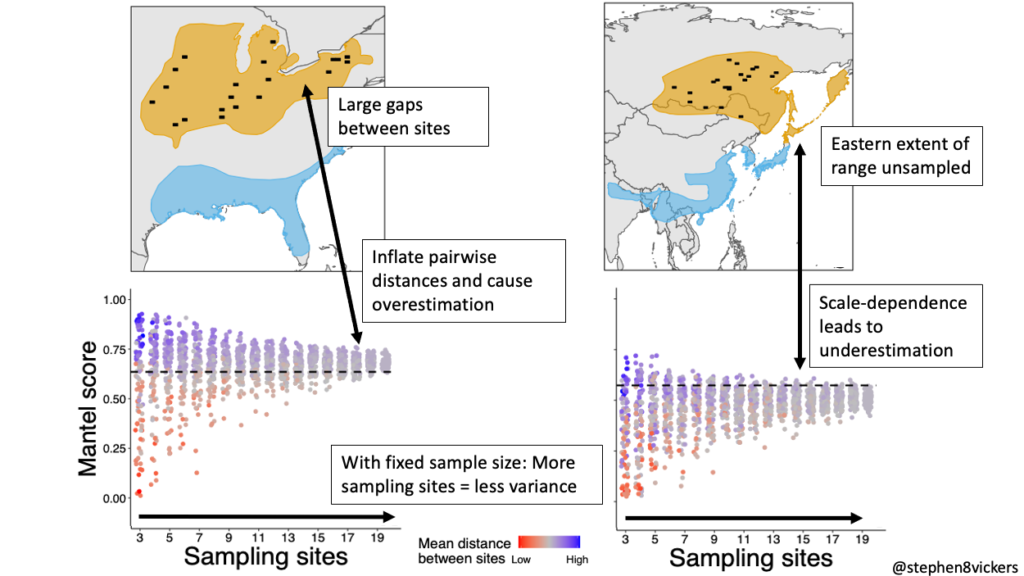 Figure 3 Avoiding excessive bias as a result of sampling may require a careful balance between site spacing and adequate coverage of the population range.
In conclusion
Using simulated examples, we have shown that the use of Mantel statistics to describe the strength of connectivity is vulnerable to biases, but with good sampling regimes, we can take steps to limit these. We propose three tips to help improve the use of Mantels:
- Maximise the number of sampling sites, even if that means fewer samples per site – this will maximise precision in estimates.
- Ensure sites are well distributed across the range measured – this will help avoid scale-dependence and between site distance introducing skewed pairwise distances.
- Avoid making between study/cohort comparisons if sampling regimes or spatial scale differ substantially – any such comparisons are likely to tell you as much about the different sampling designs as they do about the differences in underlying migration behaviour!
References
Cohen, E.B., Hostetler, J.A., Hallworth, M.T., Rushing, C.S., Sillett, T.S. & Marra, P.P. 2018. Quantifying the strength of migratory connectivity. Methods in Ecology and Evolution 9:513-524.VIEW
Finch, T., Butler, S.J., Franco, A.M.A. & Cresswell, W. 2017. Low migratory connectivity is common in long‐distance migrant birds. Journal of Animal Ecology 86: 662-673. VIEW
Smithsonian Migratory Bird Center The migratory connectivity project website VIEW
Image credit
Top right: Northern Wheatear Oenanthe oenanthe © Stephen Vickers