A new image processing tool for coloration and patterning analysis in ecology applications
LINKED PAPER
SpotEgg: An image-processing tool for automatised analysis of coloration and spottiness. Gómez, J. & Liñán-Cembrano, G. 2017. Journal of Avian Biology. DOI: 10.1111/jav.01117. VIEW
The variety of coloration and patterning among organisms has historically drawn great interest not only from specialized scientists (e.g. evolutionary biologists) but also from the general public. Nevertheless, scientifically speaking, the process of measuring coloration and patterning is not a simple task at all. Indeed, the approaches used in many studies are limited by relying on methods suffering from subjectivity, low repeatability and lack of standardization.
SpotEgg
Our tool, SpotEgg, was designed with the aim of providing researchers, not being image-processing experts, with a standardized method to employ in coloration and patterning analyses using digital images taken, mostly, in the field. Originally, SpotEgg was conceived for eggshell pictures analyses (that’s where its name came from), however, its library of functions was soon expanded to cover subjects of arbitrary shape, making it able to process Regions of Interest (RoIs) which may correspond to a frog, a feather, a butterfly, etc. Also since the beginning, we decided to freely-distribute SpotEgg’s functionality through a Graphical User Interface (GUI; Fig.1) not requiring any knowledge of the particular coding of its internal functions nor coding language (the current version 6 contains nearly 60 internal functions and more than 50,000 lines of code). As shown in Figure 1, the user just needs to define the folder where the images to be processed are stored, and the folder where SpotEgg will write its results, and click on a few buttons and options to run the available analyses.
 Figure 1 SpotEgg graphical user interface (GUI)
Our tool’s operational workflow consists of three independent steps, namely; Linearization, RoI definition, and, Spot detection. Let us briefly describe each of these processes (see Fig.2 for typical results provided by SpotEgg).
Linearization:
The first step is to generate what we call the Equivalent Reflectance Images (ERIs), which are images whose pixels correspond to average reflectance values in the sensor colour bands (red, green and blue commonly). Producing these images requires, first, to have an object in the scene whose reflectance is known and constant within the visible wavelengths (typically denoted as grey patches). This object’s pixel values will be used as scaling coefficient for normalization. Second, it also requires the whole image to be linear with respect to irradiance in order to obtain meaningful values after normalization. It is worth mentioning here that SpotEgg has been programmed to automatically detect a particular colour calibration chart (ColorChecker Passport, USA X-Rite, with six grey patches) and, thus, linearization can be carried out completely free of user interaction. When input images contain raw information (the preferred format), our tool will decode them (internally calling dcraw) and normalize it using information from the grey patch (either automatically detected or clicked on by the user). Alternatively, when images do not contain raw data (e.g. when stored in JPG format), the only way to produce ERIs is to revert all nonlinearities with respect to irradiance. In order to do so, the scenes need to contain a number of grey patches of different reflectances (the larger the number, the better the linearization), which will allow the tool to calculate how to revert the non-linear mapping curve applied to each image. Again, this process can be done automatically if the images contain the colour calibration chart mentioned above, or manually (by clicking on grey patches) when the user has employed any other calibration target. As a rule of thumb, whenever you are interested in colour information in your analyses, always store the images as raw data.
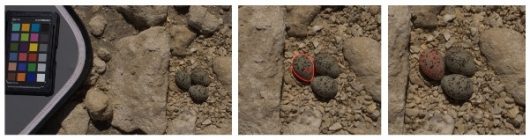 Figure 2 Images through the different steps of the SpotEgg’s workflow for a Kentish Plover Charadrius alexandrinus nest (left: original image; centre: RoI Defined after linearization; (right): Spots detected.
RoI Definition:
Users define image regions to be analysed in this step. When the subjects under study are eggshells, users can command SpotEgg to try autodetection of egg-like shapes. When this is not the case, or if autodetection failed, the user will be asked to define how many regions to define in each image, and to manually draw each of them by clicking on points around its perimeter. Once all files are processed, SpotEgg will produce a number of RoI reports (as CSV files), which include, among many other variables, the average and standard deviation of the reflectance values (R,G, and B) within each of the RoIs, some physical properties for each RoI (including size, length, width, orientation in the image, centroid, etc.). Yet another interesting feature in the currently available version of SpotEgg is that users can also draw a line across each RoI and get reflectance values (together with accumulated distance) along this line.
Spottiness Processor
Without any doubt, the Spottiness Processor is the main innovation introduced in SpotEgg. Roughly speaking, it runs a Foreground/Background segmentation based on automatically calculated locally defined thresholds (the most important details are provided in SupMat in Gómez, J., & Liñán-Cembrano, G., 2017). Perhaps the most interesting feature for the user is that spot detection process is determined by only four parameters. That is, four meaningful numerical values which can be shared among researchers, guaranteeing to get the same result for the same set of parameters and the same dataset, flushing out any king of subjectivity.
Users define the parameters for spot detection through an iterative process which displays a GUI (Fig. 3) where parameters are defined, and results presented to the user for validation.
 Figure 3 GUI Presented during Spot Detection Parameters Definition Phase
Once the whole dataset is processed, spottiness and coloration reports and result images (showing detected spots) are produced. All reports are provided as standard CSV files allowing SpotEgg results to be directly transferred to other statistical analysis tools.
Pros, cons, and perspectives for digital image processing analysis in ecology applications
Coloration and patterning in wildlife has always attracted the attention of scientists, and it is becoming nowadays a very hot topic of research in evolutionary ecology. Frequently, researchers try to relate those visual aspects with evolutionary explanations as how they affect camouflage, female attraction, protection from overheating, etc. (Troscianko et al. 2016, Gómez et al. 2016, Lorenzo et al. 2017).
Talking about the advantages of using conventional digital cameras to acquire images in ecology applications (especially when taking photos in the field) one needs to mention their low cost. Digital cameras are probably the cheapest devices that allow area-wide coloration and patterning measurements. Furthermore, digital cameras are extremely easy to handle and carry in the field, especially when compared to alternative solutions such as spectrometers or the recently introduced multispectral cameras (a technology still in a very early phase which, for sure, will be much more ubiquitous in the future), which most often require attaching the sensing device to a computer to collect the data, and also a well-trained user to conduct the measurements.
Nonetheless, using digital cameras as data acquisition devices in coloration applications also brings some limitations to the attainable results. Firstly, digital cameras are constrained to acquiring information in the visible wavelength range only. This limitation does not simply come from the UV and NIR filters existing in the typically mounted optics (which can be tweaked), but also from the physical properties of the silicon (the bulk material out of which most of the electronic image sensors are made) which preclude it from obtaining good quality images in the UV band. This UV limitation means that use of conventional digital cameras is not advisable in experiments whose aim is to check for relevant signalling functions in animals having UV vision. Moreover, limitations do not only exist outside the visible spectrum, but also within it. Commercial digital cameras only produce three colour channels, the well-known Red-Green-Blue triplet. Thus, all spectral information is limited to just three values which, indeed, are the result of an integral operation involving the pixel wavelength-dependent sensitivity and the spectral response of the colour filters deposited on top of the sensor. Therefore, digital commercial cameras are not really well suited in experiments trying to extract information at a particular (or a narrow range) wavelength. Fortunately, animal visual systems do also perform the same kind of broad range wavelength integration, and their visual sensors typically exhibit the same bell-shaped sensitivity curves as those featured by the sensors in digital cameras, therefore, if we target our research towards “visual signalling”, using digital cameras is a valid approach.
We believe that in the next years the relevance of digital image processing tools like SpotEgg, will exponentially rise in ecological studies for analysis of coloration and patterning, and most probably, research teams will, as in our case, incorporate both image processing experts and ecologists. We are also convinced that multispectral cameras will play an important role in the mid-term future once their supporting technologies reach a higher level of maturity and costs become affordable to extend their user community.
SpotEgg was created for a dual purpose: firstly, for improving standardization and, secondly, for reducing the researcher’s time devoted to automatable tasks. We think that this tool is useful not only for ornithologists, but also for other evolutionary biologists interested in coloration and patterning analyses. Since its introduction, we have already released six updates for SpotEgg, trying to cover requests from new users all around the world, and broadening its capabilities beyond our original concept.
References
Gómez, J., Pereira, A.I., Pérez-Hurtado, A., Castro, M., Ramo, C. & Amat, J.A. 2016. A trade-off between overheating and camouflage on shorebird eggshell colouration. Journal of Avian Biology 47: 346-353. VIEW
Gómez, J. & Liñán-Cembrano, G. 2017. SpotEgg: An image-processing tool for automatised analysis of coloration and spottiness. Journal of Avian Biology 48: 502–512, 2017. VIEW
Pérez-Rodríguez, L., Jovani, R. & Stevens, M. 2017. Shape matters: animal colour patterns as signals of individual quality. Proceedings of the Royal Society B: Biological Sciences 284 (1849). VIEW
Troscianko, J., Wilson-Aggarwal, J., Stevens, M. & Spottiswoode, C.N. 2016. Camouflage predicts survival in ground-nesting birds. Scientific reports 6: 19966. VIEW
Image credit
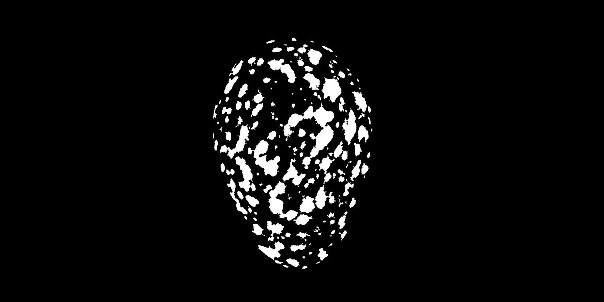
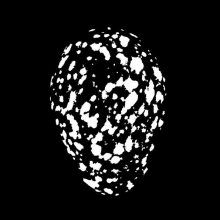
Featured image: Spot Detection Obtained with SpotEgg
If you want to write about your research in #theBOUblog, then please see here.