![]()
Well-established, traditional metrics such as the Impact Factor report at the journal level. The increase in online usage and the development of new tools for article discoverability and measurement now allow for the immediate impact of the individual article to be measured.
Altmetric tracks the online attention of scholarly articles by pooling data from three main sources:
- social media (e.g. blogs, Twitter, Facebook, Google+, Pinterest)
- traditional media (both mainstream news outlets and science specific outlets inc. non-English language outlets)
- online reference managers (e.g. Mendeley, CiteULike)
How an article is measured and scored
Altmetric . . .
- measures the attention generated by, not quality of, an article
- only tracks public online attention
- tracks direct attention (that is items with direct links to the article)
- provides a single metric per article
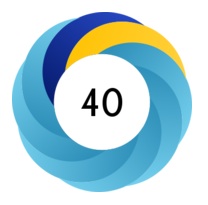 After aggregating all of the information it can find about an individual article, Altmetric looks at both the quantity and the quality of the attention being paid to an article. Each piece of information collated is known as a post from which a visual summary of the article’s attention is produced as a coloured circle around a number. The coloured circle visualizes where the posts mentioning the article came from – mainstream news outlets (red), Twitter (pale blue), Facebook (dark blue), blogs (yellow), etc. – while the number in the centre is the article’s total (attention) score measured from the posts. The score is a quantitative measure of the quality and quantity of attention that the article has received (you can read more about the scoring algorithm here).
The score is influenced by two factors – the quantity of posts mentioning an article and the quality of each post.
Quantity is a relatively straightforward measure: the more posts mentioning an article the higher its score. Quality is measured in differently:
- Higher profile (e.g. The Guardian) posts are worth more than lower profile (a blog) ones. A blog post contributes more than a tweet.
- Who authored each post is also important. For social media sites Altmetric fetch an author’s list of followers, a list of their past posts and information about how often those posts were liked, retweeted or reshared. Peer-to-peer tweeting and retweeting (i.e. a tweet from a researcher followed by other researchers) will contribute more than an automated tweet from a journal’s press office.
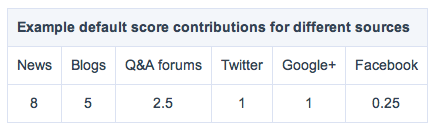
Altmetric asked researchers to rank different sources in order of how important they were to an article’s broader impact. From this a scoring system was produced to apply to each article:
© Altmetric/Digital Science
So if your paper has been mentioned by a news story, been blogged about and received three tweets it might score 16 (8 for a single News contribution + 5 for the blog post + 3 for three tweets/retweets). Scores are also rounded up, so if the same article then received a Facebook post, it would receive an additional 0.25, giving a total of 18.25, rounded up to give a total of 19.
What have you got
Altmetric allows direct access to the online conversations surrounding an individual article and for article comparison within a discipline.
All Ibis articles are promoted by the BOU on Twitter (@IBIS_journal) and Facebook (facebook.com/ibisjournal). However it takes more than a couple of tweets/posts from us to begin to affect your Altmetric score – it requires authors and others to retweet/share what the BOU itself puts out, and vice-versa. If we see it we will retweet/share any items relating to Ibis articles, not simply to increase the articles Altmetric, but to share and promote Ibis content within our online ornithological community. And writing a piece to accompany your article for the BOU Blog has never been more advantageous – a blog post now carries considerable weight for your article’s Altmetric score.
So, once your article has been published and promoted and received enough attention to be measured by Altmetric, you look for the Altmetric score on the online version of the paper – indicated by the arrow below.

The score can be seen but if you click on the Altmetric icon you are taken to the breakdown and how the score was arrived at (below).

The five main tabs above provide greater breakdown of where your article was mentioned.
What’s the point?
Until now metrics have largely focused on measuring an individual journal’s impact and reach. Moving measurement focus to the individual article makes the metric data more relevant as it can focus more accurately on specific research topics (i.e. an individual topic within a wider research subject) and, importantly, on authors. As article metrics become the norm we can expect journal metrics to increasingly incorporate article metric data, and authors can expect to see article metric data becoming increasingly relevant to their work, e.g. used for REF (Research Excellence Framework) in the UK.
In a survey conducted by our publisher, Wiley, during their Altmetric pilot, 87% of respondents said they would use the metrics to gauge the popularity of an article and 77% said they would use the metrics to discover and network with researchers conducting similar work.
But remember, the Altmetric score is useful to rank articles based on attention, but it can’t tell you anything about the quality of the article itself, though reading the linked discussions might.
Further reading
. . . and source information for this blog.
About Altmetric and the Altmetric score
5 tips for improving your article’s Altmetric score
Altmetric is now on board for all Wiley journals
Making life easier for researchers | A Q&A with Altmetric’s Amy Brand
Making social media and the web work for you