A closer look at the effects of changing seasonal weather conditions give us new insights into what to expect from ongoing climate change
LINKED PAPER
Continent-scale global change attribution in European birds – combining decadal and annual time scales. Jørgensen, P. S., Böhning-Gaese, K., Thorup, K., Tøttrup, A. P., Chylarecki, P., Jiguet, F., Lehikoinen, A., Noble, D. G., Reif, J., Schmid, H., van Turnhout, C., Burield, I. J., Foppen, R., Vorisek, P., van Strien, A., Gregory, R. D. & Rahbek, C. 2015. Global Change Biology. DOI: 10.1111/gcb.13097 VIEW
Of all the ways climate change is affecting and will affect birds (see e.g. BirdLife report), poleward changes in the numbers and occurrences of species has probably received the most attention (Parmesan et al. 2003, 2006). In Europe, we have over the past decades seen a shift in the occurrence and abundance of our breeding birds toward the poles in the form of increasing abundance of southern species and decreasing numbers of northern species (e.g. Jiguet et al. 2010, Gregory et al. 2009). Similarly, we have seen how heatwaves and cold-snaps can simulate expected effects of climate change. The European heatwave in the summer of 2003 stands as an example of how extreme heat is likely affect bird communities in the future (Jiguet et al. 2006).
However, by themselves, both of these types of observations are limited in their nature. Many conditions have changed over the recent decades, so how do we know that poleward shifts are caused by climate change? Similarly, are effects of extremes such as the European heatwave in 2003 just one-off events? While questions such as these may seem unnecessary or controversial given the ever increasing evidence for the impacts of climate change, they underline the importance to keep increasing the skill with which we attribute changes in bird communities, and our natural world in general, to climate change (Parmesan et al. 2011, 2013).
In a recent study we decided combine the desirable long-term perspective of the observed poleward shifts with the detailed short-term resolution yielded by responses to extreme events. Combining the two approaches should get us an even better foundation on which to attribute responses to recent climate change.
Combining two perspectives to increase certainty and gain new insights
To do this we analysed the unique dataset documenting the numbers of common European breeding birds, collected by roughly 50.000 birdwatchers across Europe over the past decades and coordinated by the Pan-European Common Bird Survey. We focused on the two most recent decades where warming has been pronounced. We further narrowed our scope to about 50 species that all use farmland habitats and therefore have been impacted not only by changes in climate, but also the marked changes in land use associated with agriculture.
We first we looked at whether poleward changes could be independently detected in open competition with a number of other changes such as the well documented decline of farmland specialists and long-distance migrants. This would increase certainty that poleward shifts are not an artefact of patterns caused by other environmental changes.
Second, we associated year-to-year changes in population numbers with changing winter, spring and summer weather across the two decades. This should tell us whether poleward shifts in abundance can consistently be found as a result of warming on a time scale where most other factors are essentially unchanged.
Our results provide an encouraging perspective on the level of detailed information this amazing European dataset holds!
Poleward shifts can be found on the year-to-year level
Two of the main findings from our study show that poleward shifts in abundance are not redundant with effects of agricultural land use change and that year-to-year changes in population numbers confirm that weather events associated with climate change cause poleward shifts in abundance. I will elaborate briefly on the latter, here.
At the national scale, poleward shifts related to climate can be detected when species distributed further south, i.e. in warmer parts of the continent, increase and species distributed further north decrease. If warmer weather is causing these shifts, we should expect to see Southern species increase in comparison with Northern species following warmer years.
And that’s what we found! Following a year with warm winters or years with earlier onset of the growing season, species living under warmer climates increase in numbers compared to species living under colder climates.

This could be an important finding. We are now no longer talking about poleward shifts over decades or in association with single extreme events, but systematic poleward changes from year to year over two decades as the weather has warmed.
Not only how much warming, but when and where
Perhaps one of the most intriguing insights from our study is that, to predict the composition of our future bird communities we need to understand, not only how much the climate will change, but also in which seasons these changes will manifest. This is the case in particular when it comes to species with different migratory strategies. When we divided species into groups of residents (wintering in their breeding country), short-distance migrants (wintering in Europe) and long-distance migrants (wintering in Africa) we found that they were affected by weather changes in three separate seasons.
Thus, resident species increase in years after warmer winters, short-distance migrants increase in years after an earlier spring growing season, and long-distance migrants increase following years with a warmer summer. These results are of course in line with the sequence at which these species start breeding.
This is both an intriguing and a troubling finding. It is intriguing that such fine scale variation in how climate change manifests across seasons is likely to alter the numbers of migrants compared to non-migrants. However, it is also troubling since the details of how climate change will manifest locally across seasons is still a subject being debated and worked on by climate modellers.
For our wonderful long-distance migrants the picture becomes even more complicated as they are not only impacted by the seasonal details of climate change in the breeding area, but also in their Sub-Saharan wintering range. Here we find that larger amounts of green vegetation (as opposed to drought conditions) benefit multiple species. This was the case in particular for species wintering in the central and eastern parts of Sub-Saharan Africa north of the Congo rainforest basin.
Land use and climate change combines to increase threat
What happens then when you combine climate change with the pronounced land use changes we have seen over the past decades? Our results indicate that climate vulnerable species such as long-distance migrants have declined more in areas with more intensive agriculture. This may be a sign that the capacity of long-distance migrants to adapt to climate change hinges on the availability of enough quality breeding habitat currently at risk from intensive land use practices.

There are therefore multiple reasons we should consider increasing the amount of available habitat, if the goals is to protect species from climate change. First, it will decrease the pressure from other global changes, such as agricultural intensification, that may make species more vulnerable to climate change. Secondly, it will make it easier for a larger number of species to coexist and for species to shift their ranges northward as the climate change we have already committed to within our current emissions continues to occur for the next decades.
References
BirdLife International. 2015. The Messengers – What birds tell us about threats from climate change and solutions for nature and people. https://climatechange.birdlife.org/
Gregory, R.D., Willis, S.G., Jiguet, F. et al. 2009. An indicator of the impact of climatic change on European bird populations. PLoS ONE 4: e4678. View
Jiguet, F., Julliard, R., Thomas, C.D., Dehorter, O., Newson, S.E. & Couvet, D. 2006. Thermal range predicts bird population resilience to extreme high temperatures. Ecology Letters 9: 1321–1330. View
Jiguet, F., Devictor, V., Ottvall, R., Van Turnhout, C., Van der Jeugd, H. & Lindstrom, A. 2010. Bird population trends are linearly affected by climate change along species thermal ranges. Proceedings of the Royal Society B: Biological Sciences 277: 3601–3608. View
Jørgensen, P. S., Böhning-Gaese, K., Thorup, K., Tøttrup, A. P., Chylarecki, P., Jiguet, F., Lehikoinen, A., Noble, D. G., Reif, J., Schmid, H., van Turnhout, C., Burield, I. J., Foppen, R., Vorisek, P., van Strien, A., Gregory, R. D. & Rahbek, C. 2015. Continent-scale global change attribution in European birds – combining decadal and annual time scales. Global Change Biology. View
Parmesan, C. 2006. Ecological and evolutionary responses to recent climate change. Annual Review of Ecology Evolution and Systematics 37: 637–669. View
Parmesan, C. & Yohe, G. 2003. A globally coherent fingerprint of climate change impacts across natural systems. Nature 421: 37–42. View
Parmesan, C., Duarte, C., Poloczanska, E., Richardson, A.J. & Singer, M.C. 2011. Overstretching attribution. Nature Climate Change 1: 2–4. View
Parmesan, C., Burrows, M.T., Duarte, C.M., Poloczanska, E.S., Richardson, A.J., Schoeman, D.S. & Singer, M.C. 2013. Beyond climate change attribution in conservation and ecological research. Ecology Letters 16: 58–71. View
Image credits
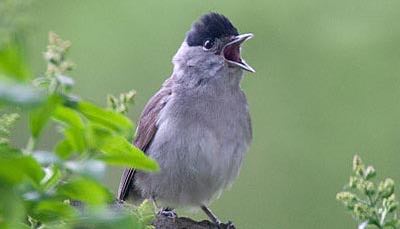
Featured image: Blackcap © Jerzystrzelecki via Wikimedia Commons.
If you want to write about your research in #theBOUblog, then please see here.


