
LINKED PAPER
Exploring the relationship between flapping behaviour and accelerometer signal during ascending flight, and a new approach to calibration. van Walsum, T.A., Perna, A., Bishop, C.M., Murn, C.P., Collins, P.M., Wilson, R.P. & Halsey, L.G. 2019. IBIS. DOI: 10.1111/ibi.12710. VIEW
We understand little about flight energetic costs in wild birds, partially because the free-ranging birds can be tricky to work with (Elliott 2016, Hicks et al. 2017). However, flying is truly what makes the bird tick, as they fly to forage and migrate. Thus quantifying these costs can help us understand overall bird biology and behaviour.
A start to measure energetic costs is through accelerometry. An accelerometer is a small device that measures movement on three separate axes. From these movements we can calculate ‘dynamic body acceleration’ (DBA) (Halsey et al. 2011a,b, Qasem et al. 2012). The greater the movement of the animal, the more the accelerometer moves over the x, y, and z axes which converts to higher DBA values. This has been tried and tested and previous studies have found strong relationships between the rate of energy expenditure and DBA in a number of non-flying birds such as chickens (Gallus gallus), and Macaroni Penguins (Eudyptes chrysolophus) (Wilson et al. 2006, Green et al. 2009). Yet to date there has been no calibration of DBA with energy expenditure for birds during flight.
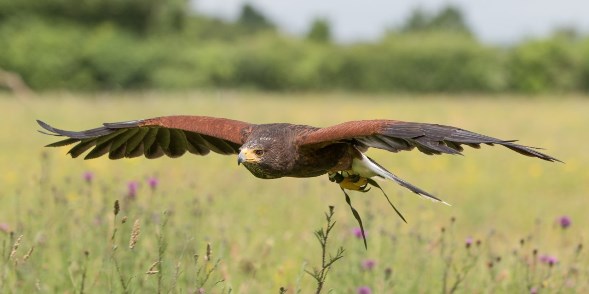
So, we put this to the test in free flying (and hungry) Harris’s Hawks (Parabuteo unicinctus) from the Hawk Conservancy Trust. We set out to measure the energetic expenditure of the Harris’s Hawk flying to different heights (Figure 1). With a known height and a short fixed distance to cover horizontally, we can calculate the energy needed to gain altitude (Energy expended = mass × gravity × height). We had each of our hawks (5 in total) fly from falconer glove to glove by enticing them with tasty treats.
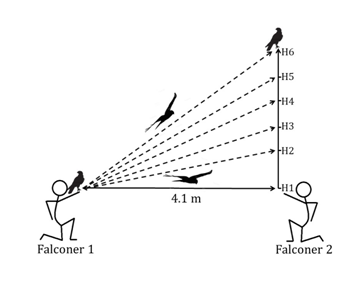 Figure 1 Schematic diagram of the experimental setup. (H1 = 0 m height gain; H6 = 4.5 m height gain). For each height condition the bird flew from falconer 1 to falconer 2
Our Harris’s Hawks show a strong correlation between DBA and energy expenditure (Figure 2). We also found that for our Harris’s Hawks, DBA was affected by both changes to wing beat frequency and amplitude. However, the relationship between DBA and energy expenditure was mostly explained by changes in wing beat frequency (or how fast the bird flapped its wings) and less so by changes in wing beat amplitude (how hard the bird flapped its wings). Overall, our study provides a starting point of evidence that accelerometry (with DBA) can be calibrated using heights.
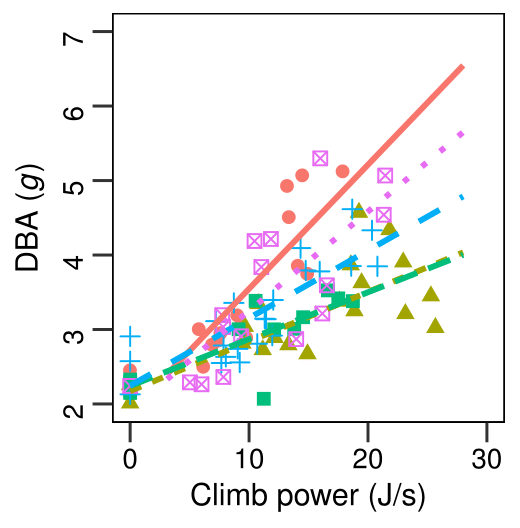 Figure 2 DBA against mean energetic cost during short flights by Harris’s Hawks (n = 5). The plotted data represent single values (n = 88), colour- and shape-coded to identify each bird. Colour- and style-coded lines of best fit are shown. NB, one best fit line (green, long dash) substantially obscures another (olive, short dash). Bird 1, red full and circle symbols, R2 = 0.80. Bird 2, olive short dash and triangle symbols, R2 = 0.58. Bird 3, green long dash and squared symbols, R2 = 0.64. Bird 4, blue wide dash and plus symbols, R2 = 0.70. Bird 5, mauve stippled and cross squared symbols, R2= 0.66
After our studies with the Harris’s Hawk we decided to take a closer look at the changes in DBA over different flight patterns. How will a change in wing beat frequency (how fast the bird flaps) affect DBA? Figure 3 shows the wingtip’s movement of the modelled Harris’s Hawk in flight. At first, one might conclude that changes in wing beat frequency will not be recognized by changes in DBA, because DBA depends only on the total amount of height change and not on its frequency (Figure 3). However, it would be wrong to conclude that the bird would be able to perform the profile presented in Figure 3b by increasing flapping frequency yet maintain constant wing beat amplitude. In fact, for Figure 3b the bird would have to increase overall acceleration to move its wing from top to bottom in a shorter period of time, resulting in a higher DBA.
So, a larger flapping amplitude for a given wing beat frequency registers higher acceleration values and, for a given flapping amplitude, a higher wing beat frequency will register higher acceleration values. Simply put, a flapping wing must speed up and slow down more rapidly if it is moving further per unit time or flapping more frequently. Thus, even if inspection of the profile of the bird’s body movements in centimetres (in reaction to its wing beats) does not show any change in gain in response to a change in its wing beat frequency (Figure 3a), DBA derived from an accelerometer installed on the bird’s back should nonetheless recognize this variation in flapping behaviour (Figure 3b).
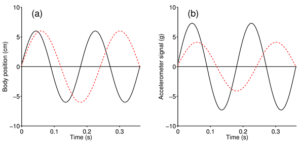
Figure 3 Modelled relationships between body movement (related to wing beat amplitude), acceleration amplitude and wing beat frequency. (a) Two hypothetical flapping profiles, here shown as sinusoidal curves, with exactly the same amplitude but different frequencies (black curve: 5.5 Hz; red dashed curve: 4.125 Hz). While in (a) they reach the same amplitude, in (b) the calculated acceleration (in units of g) is different. For the bird to follow the black curve (higher flapping frequency) the wings need to move the same distance at a shorter time, meaning an overall increase in acceleration
Overall, bird flight is a bit more complicated than just travelling straight from a to b. This means that the relationship between DBA and energy expenditure cannot be easily predicted from simple theoretical considerations: the very birds you study could switch between different flapping techniques (how fast or how hard they flap), leading to effects on DBA that are difficult to predict. We provide the first experimental relationship between DBA and rate of energy expenditure climbing flight. These experiments also enabled us to investigate what aspects of wing kinematics (e.g. increased flapping frequency or flapping amplitude) drive power output in this particular flight scenario and how effectively DBA can describe these kinematics.
Nominate this article for a BOU Science Communication Award.
References
Elliott, K.H. 2016. Measurement of flying and diving metabolic rate in wild animals: review and recommendations. Comp. Biochem. Physiol. A Mol. Integr. Phys. 202: 63–77. VIEW
Green, J., Halsey, L., Wilson, R.P. & Frappell, P.B. 2009. Estimating energy expenditure of animals using the accelerometry technique: activity, inactivity and comparison with the heart-rate technique. J. Exp. Biol. 212: 471–482. VIEW
Halsey, L., Shepard, E. & Wilson, R. 2011a. Assessing the development and application of the accelerometry technique for estimating energy expenditure. Comp. Biochem. Physiol. A Mol. Integr. Physiol. 158: 305–314. VIEW
Halsey, L.G., Jones, T.T., Jones, D.R., Liebsch, N. & Booth, D.T. 2011b. Measuring energy expenditure in sub adult and hatchling sea turtles via accelerometry. PLoS ONE 6: e22311. VIEW
Hicks, O., Burthe, S., Daunt, F., Butler, A., Bishop, C. & Green, J.A. 2017. Validating accelerometry estimates of energy expenditure across behaviours using heart rate data in a free-living seabird. J. Exp. Biol. 220: 1875–1881. VIEW
Qasem, L., Cardew, A., Wilson, A., Griffiths, I., Halsey, L., Shephard, E.L.C., Gleiss, A.C. & Wilson, R.P. 2012. Triaxial dynamic acceleration as a proxy for animal energy expenditure; should we be summing values or calculating the vector? PLoS ONE 7: e31187. VIEW
Wilson, R.P., White, C.R., Quintana, F., Halsey, L.G., Liebsch, N., Martin, G.R. & Butler, P.J. 2006. Moving towards acceleration for estimates of activity-specific metabolic rate in free-living animals: the case of the cormorant. J. Anim. Ecol. 75: 1081–1090. VIEW
Image credits
Featured image: Harris’s Hawk Parabuteo unicinctus © Hawk Conservancy Trust Andover