LINKED PAPER Optimization of passive acoustic bird surveys: a global assessment of BirdNET settings. Pérez-Granados, C., Funosas, D., et al. & Sebastián-González, E. (2025) IBIS.VIEW
![]()
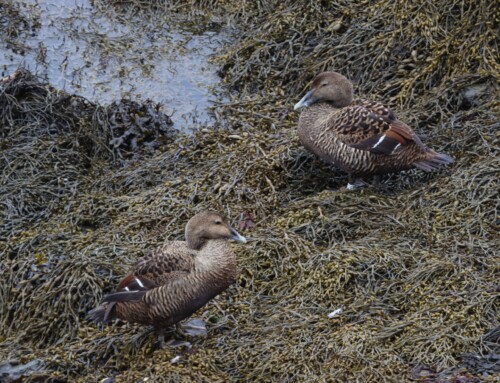
In the last decade, the development of low-cost sound recorders has greatly changed the way we monitor birds. The use of sound recorders, which started as a technique used by a reduced group of scientists, is now widely used in ecological research and by the public and managers. The decrease in the cost of the devices was a game changer, but the availability of free and easy-to-use machine learning tools, such as Merlin and BirdNET, has also been another big step in promoting the use of this technique among the public, allowing the translation of thousands of audio files into bird predictions.
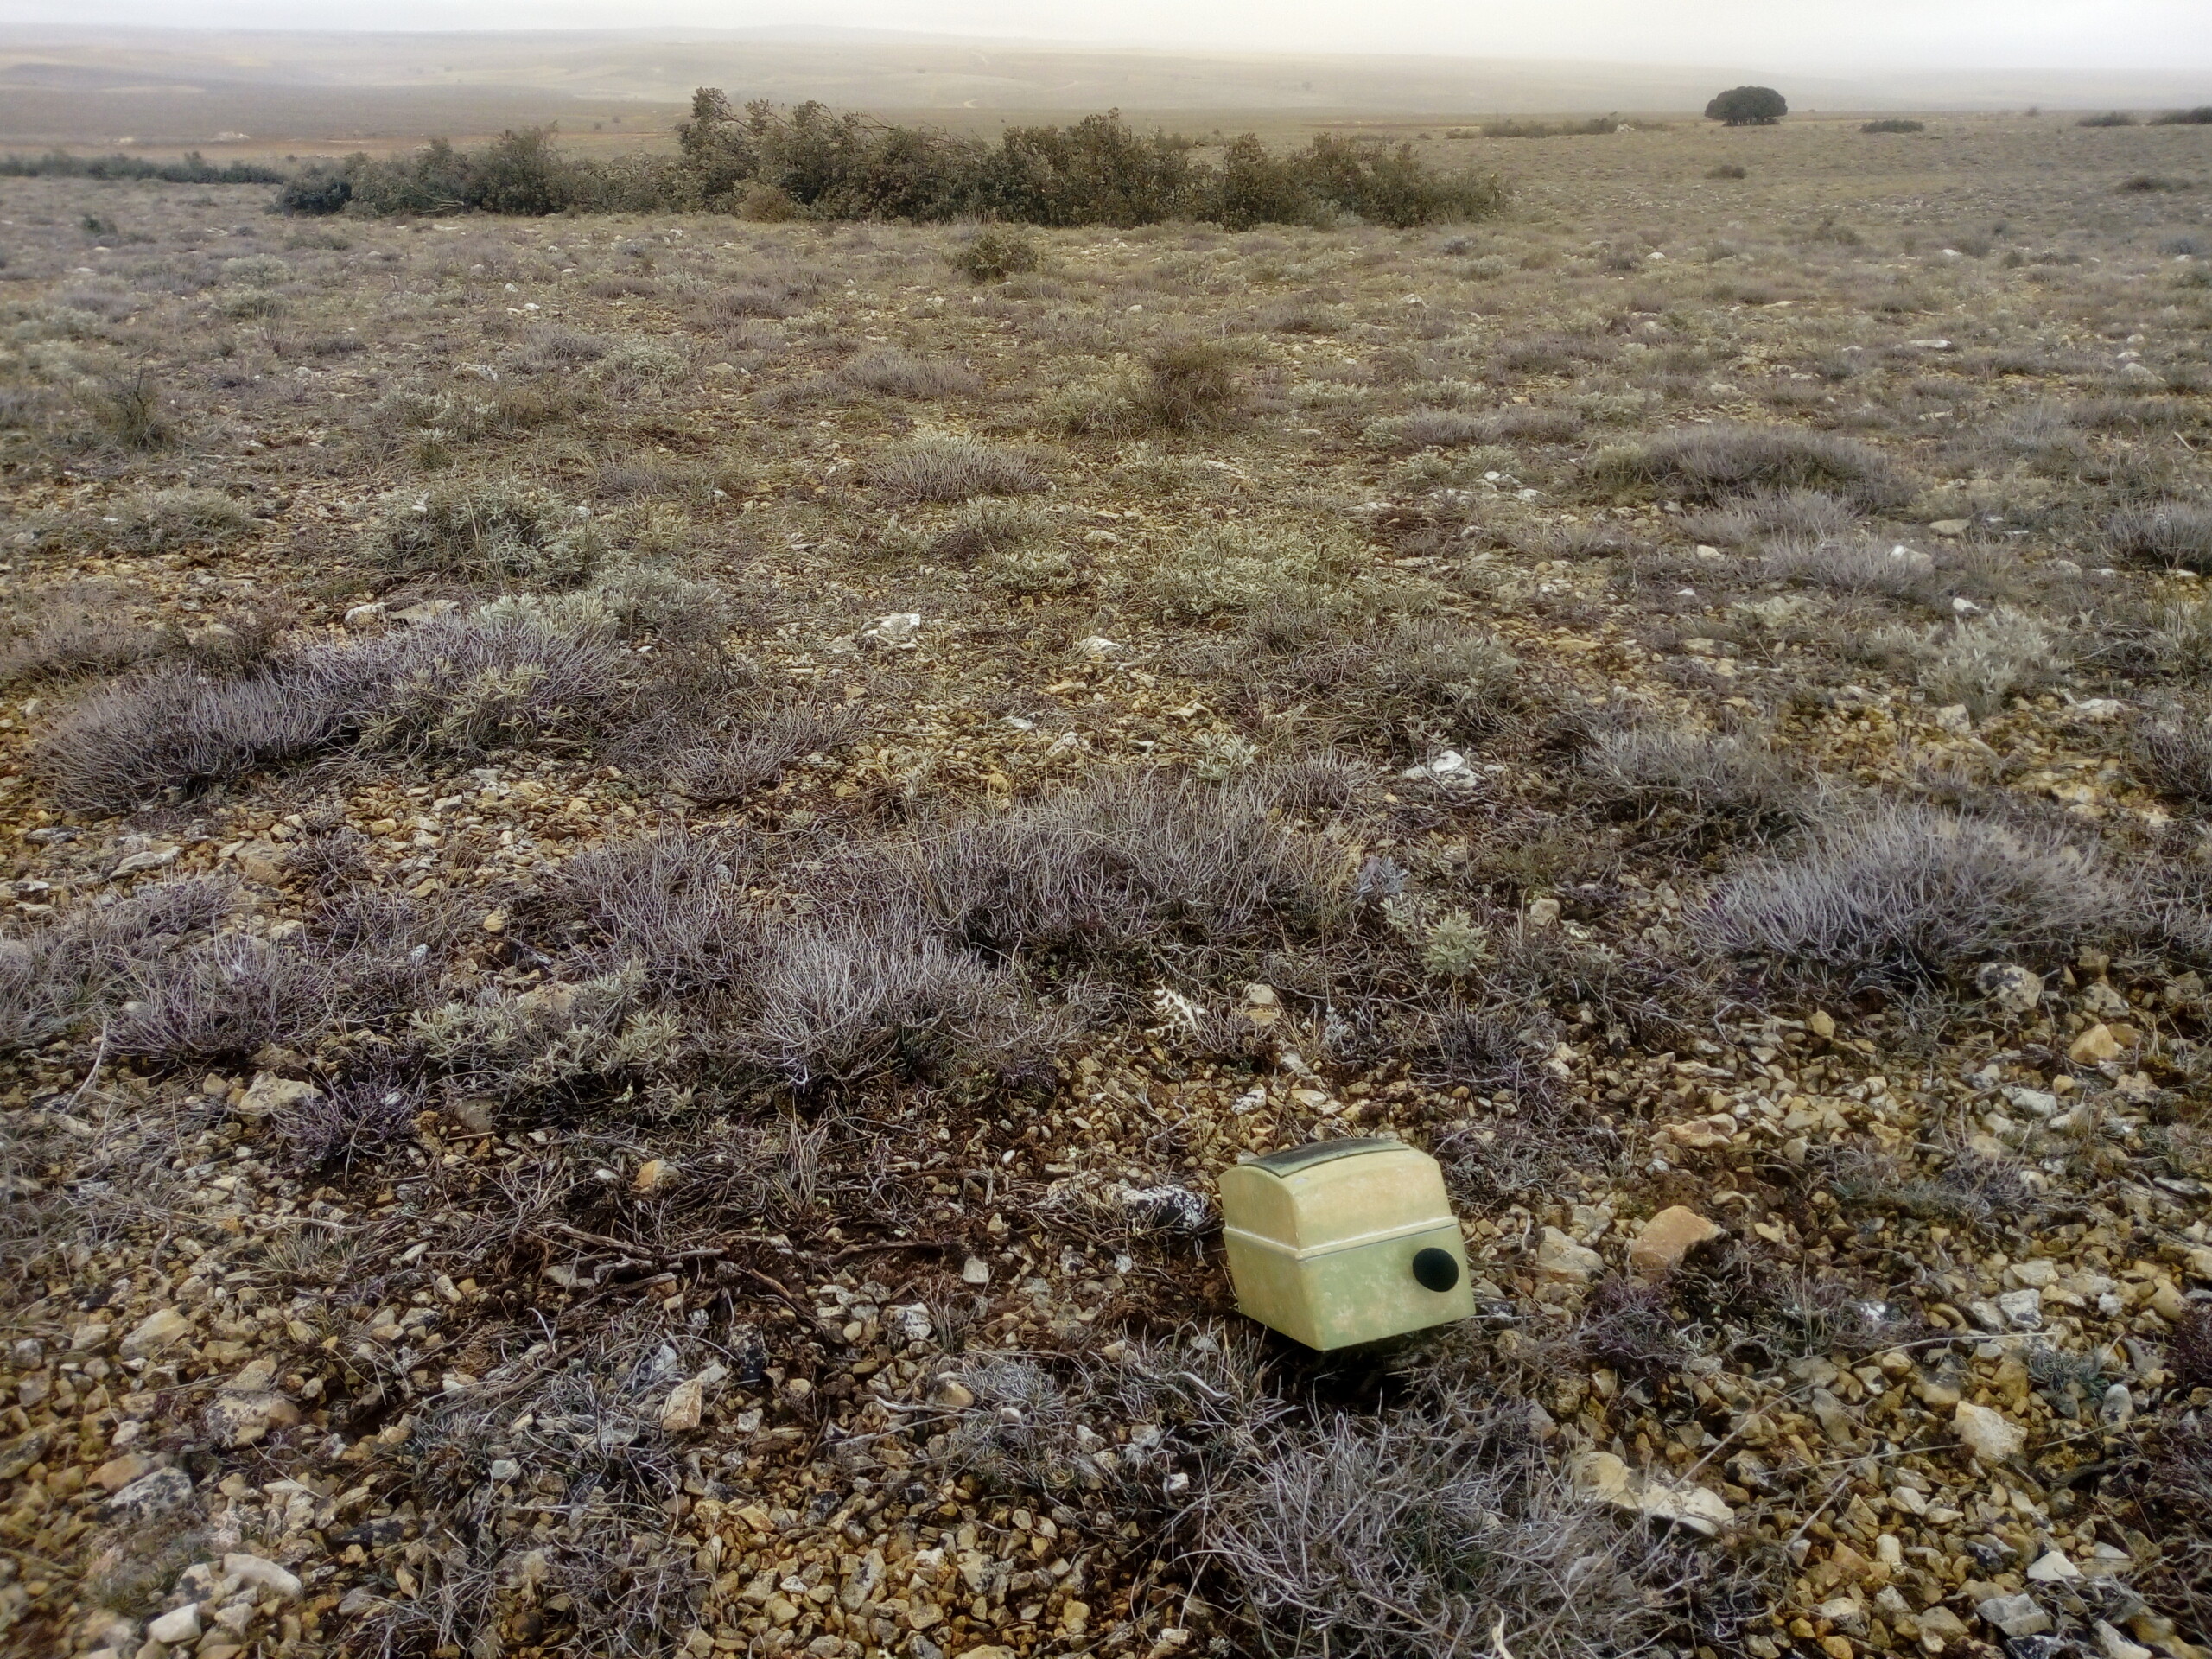 Figure 1. An autonomous sound recorder deployed to monitor the threatened Dupont’s lark in a locality where habitat management actions were implemented as part of the LIFE-Ricotí project (Barahona, Soria). © Cristian Pérez-Granados.
Among these free tools it is worth highlighting BirdNET, since it can be run in large batches of audio, through BirdNET-Analyzer. BirdNET is an automated bird recognition software able to identify over 6000 bird species worldwide by scanning the recordings and providing multi-species predictions. Although it has proven to be a very useful tool for ecologists and conservationists, it is far from being perfect, and its performance varies among species and according to the settings introduced. Recently, a large annotated acoustic dataset, entitled WABAD (World Annotated Bird Acoustic Dataset), has been released and covers over 90,000 bird vocalizations from more than > 1,100 bird species worldwide, providing a valuable resource for assessing BirdNET’s performance under different contexts.
 Figure 2. A) Mapping and number of minutes annotated per regarding recording sites in WABAD. Colours and size of dots refer to the number of minutes annotated per recording site. B) Number of annotated minutes per recording location and region. C) Number of recordings and mean number of species annotated per recording hour. D) Proportion of recordings annotated by recording unit.
One of the first questions that users have before running BirdNET is about how to get the best out of it and what impact the different settings may have on the results. Three parameter settings need to be set before running BirdNET: confidence score threshold, overlap, and sensitivity. The confidence score threshold can be summarized as how confident BirdNET needs to be to include a prediction in the output. Lower values mean that more potential detections (including some wrong ones) are included in the output, while higher values produce a more conservative output. Overlap refers to how much consecutive audio segments (BirdNET works dividing the original audio into 3-second consecutive segments) overlap when being analysed (i.e. BirdNET scans the same moment multiple times in slightly shifted windows). Sensitivity modulates the spread of confidence across, values lower than 1 increase BirdNET’s certainty in its top predictions and decrease its certainty in the bottom predictions, whereas vàlues greater than 1 make confidence scores more uniform across predictions.
Using WABAD as benchmark we systematically tested the impact of these three parameters on BirdNET performance. Overall, we can recommend to future BirdNET users that if your goal is to detect as many vocalisations as possible, lower confidence thresholds (range 0.1-0.3) might be the best option, as they balance recall and precision reasonably well. However, if you are more interested in characterising bird communities (i.e. describing which species are present in your garden or protected areas), slightly higher thresholds — around 0.5 — may provide highly reliable results while reducing the number of predictions to be reviewed. Interestingly, the most consistent finding in the study was that increasing the overlap parameter from its default (0 seconds) to about 2 seconds improved BirdNET performance, both for detecting vocalisations and characterizing bird communities. The impact of sensitivity was more complex, and seemed to vary depending on region and goals, although overall a value of 0.5 worked well for community-level studies, and a value of 1.5 may be better contribute for detecting vocalisations, especially when using lower confidence thresholds.
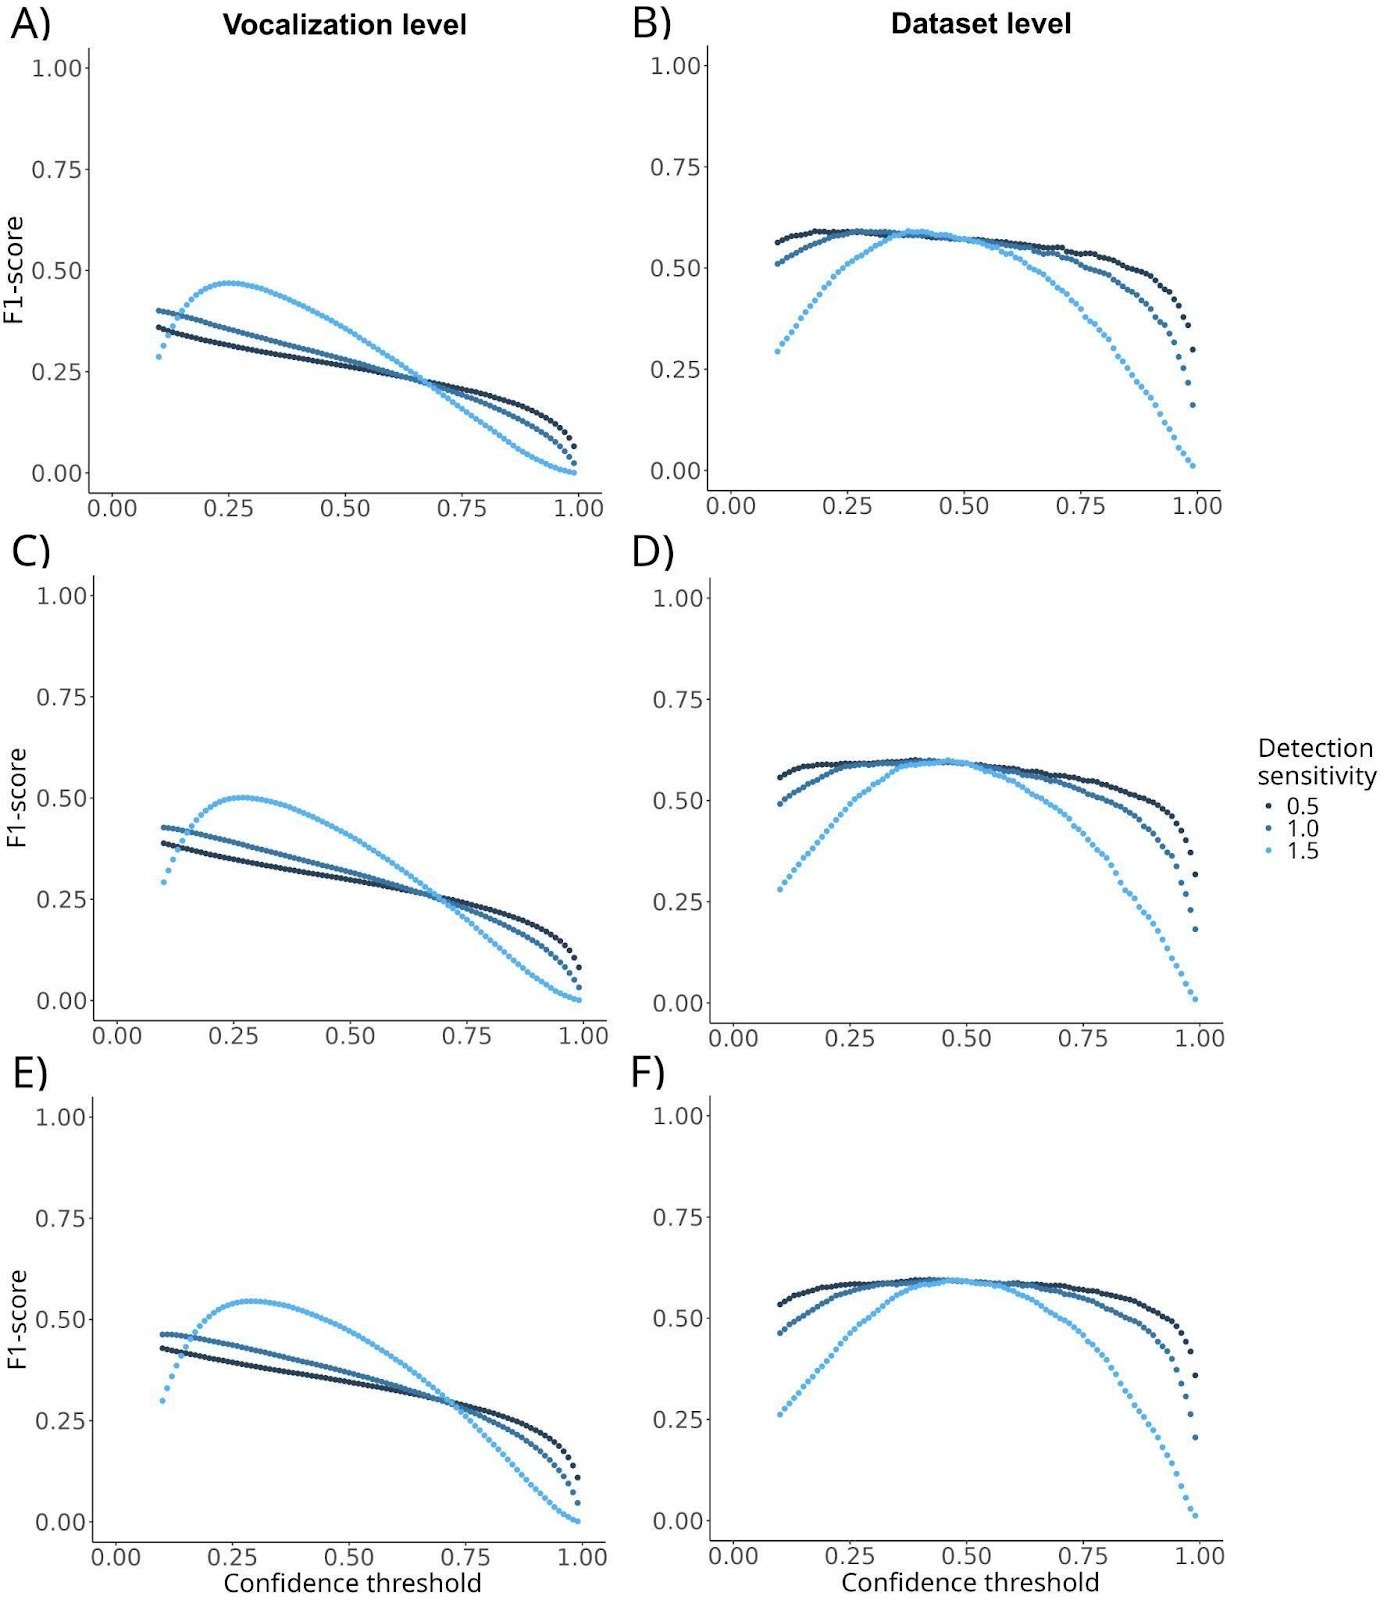 Figure 3. F1-score curves showing BirdNET precision for nine combinations of settings. The three panels on the left (A, C, and E) present results at the vocalisation level, while the three panels on the right (B, D, and F) show results at the dataset (community description) level. The panels are organised by Overlap settings: the top panels (A and B) correspond to Overlap = 0, the middle panels (C and D) to Overlap = 1, and the bottom panels (E and F) to Overlap = 2. Within each panel, the three different Sensitivity values (0.5, 1, and 1.5) are represented by three distinct colours.
In a recent study, using these optimised settings identified in Ibis, Funosas et al. tested BirdNET’s performance on a global scale. The results were encouraging but also raised doubts regarding the current effectiveness of BirdNET for automated bird monitoring worldwide. BirdNET performance wasn’t uniform among continents, and it performed better in Europe, and the Americas (both North and Central-South America), whereas its performance was noticeably worse in Africa and Asia. These results likely reflect differences in training data coverage. Overall, BirdNET performed better in those regions where a larger number of sound recordings in public libraries, like Xeno-Canto and the Macaulay Library, are available. Funosas et al. also found high variability in BirdNET performance at the species level, even besides the analyses to the species level were restricted just to those most commonly labelled in WABAD, and therefore mostly common species. Some species were consistently detected well, even at low confidence scores thresholds, whereas others were frequently missed even at high confidence score thresholds.
Overall, this research highlights that BirdNET is incredibly powerful, but it must be used critically. Using optimised parameters can improve BirdNET performance, but there are still important underlying biases, such as large differences among species and regions. Therefore, validation, through expert annotation, is essential. Although this might be a time-consuming task, resources like WABAD allow researchers to properly benchmark models, compare approaches, and understand where they perform well and where they fail. As passive acoustic monitoring will keep growing, combining effective algorithms with improved validation workflows will be key.
References
Funosas, D., Sebastián-González, E., et al. & Pérez-Granados, C. 2026. A global assessment of BirdNET performance: differences among continents, biomes, and species. Ecological Indicators 182:114550.VIEW
Kahl, S., Wood, C. M., Eibl, M., & Klinck, H. 2021. BirdNET: A deep learning solution for avian diversity monitoring. Ecological Informatics 61:101236.VIEW
Pérez-Granados, C. 2023. BirdNET: applications, performance, pitfalls and future opportunities. Ibis 165:1068-1075.VIEW
Pérez-Granados, C., Morant, J., et al. & Sebastián-González, E 2026. WABAD: A World Annotated Bird Acoustic Dataset for passive acoustic monitoring. Ecology 107(2):e70317.VIEW
Image credit
Top right and featured image: BirdNET logo © 2026 BirdNET-Team. All rights reserved.